24/7 uptime with PRTG
server availability monitoring
- Server performance metrics helps you plan for optimal server configuration
- Multiple means of alerting when hardware is starting to fail
- Out-of-the-box multiple vendor support
- Sensors for your hardware layer, virtual layer and application layers
Server availability monitoring with PRTG
![]()
Server Uptime is essential
Uptime is one number that is critical to an IT department and their management. When your servers are available then your IT services are available. Server availability includes monitoring that your hardware is up and available, that your virtual infrastructure is available, and also your critical applications and services such as databases, email, active directory, web servers, and file services to name a few.
![]()
Monitor your Remote Servers
With PRTG Network Monitor you can have that up-front view into your remote servers – you know what they are doing and how they are doing in real time and IT administrators can view historic metrics to evaluate trends. With our out-of-the-box support for multiple hardware vendors you are able to get metrics returned that are specific to your servers.
A sneak peek into PRTG Server Availability Monitoring

SNMP IBM System X System Health sensor
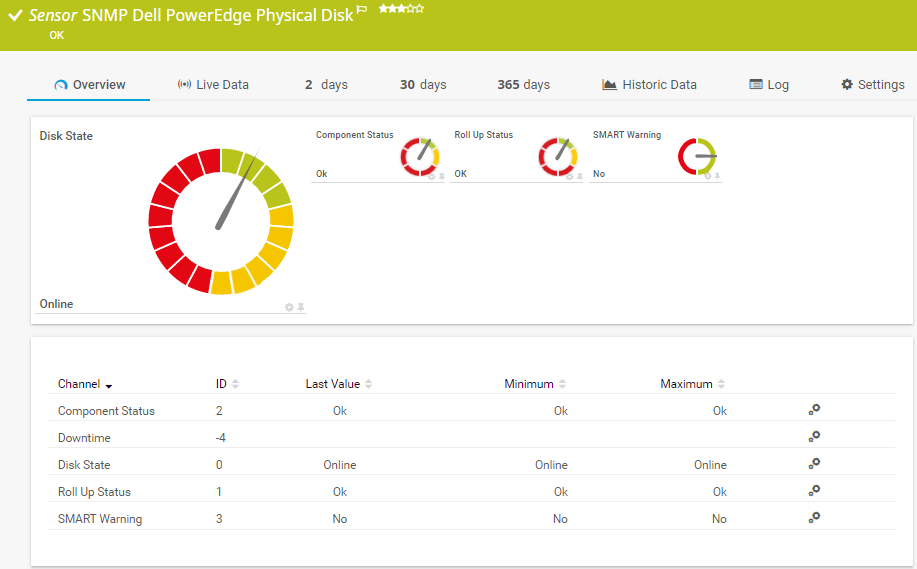
SNMP Dell Poweredge sensor
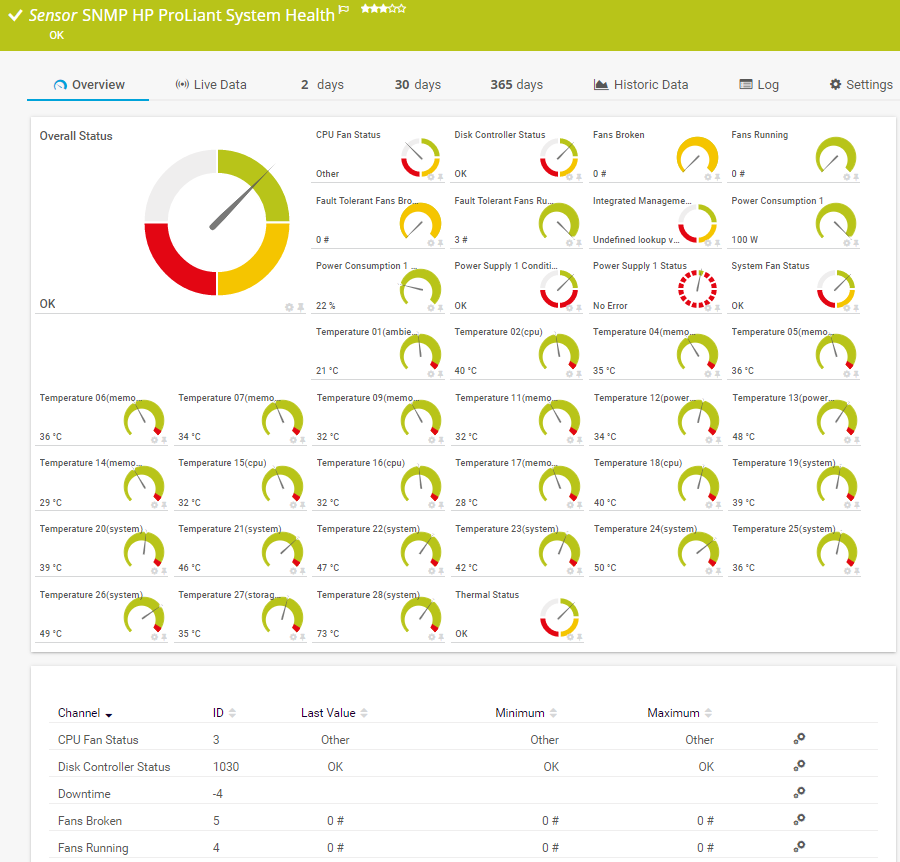
SNMP HP ProLiant System Health Sensor
PRTG offers sensors for multiple hardware vendors
![]() How PRTG defines sensors
How PRTG defines sensors
In PRTG, “sensors” are the basic monitoring elements. One sensor usually monitors one measured value in your network, e.g. the traffic of a switch port, the CPU load of a server, the free space of a disk drive. On average you need about 5-10 sensors per device or one sensor per switch port.
PRTG Network Monitor has sensors for multiple hardware vendors out of the box:
![]()
Dell Poweredge
The Dell Poweredge System Health Sensor uses SNMP to monitor and report on the overall system health of a Dell Poweredge Server – including power supply, memory, temperature and cooling device.
![]()
Dell Hardware
The Dell Hardware Sensor shows values returned by Dell specific OID values such as the system management software and hardware parameters.
![]()
HPE ProLiant
The SNMP HPE ProLiant System Health Sensor can monitor and alert on multiple aspects of your HPE ProLiant Server from fault tolerant fans to the temperature of multiple hardware components. This sensor also includes a channel for the Integrated Management Log.
![]()
IBM X
The IBM X System Health Sensor can provide alerts and metrics on the voltage of planars, revolutions per minute of fans, status of power supplies and the temperature of CPUs.
Your server availability monitoring at a glance
– even on the go
Set up PRTG in minutes and use it on almost any mobile device.


Generic SNMP and WMI Sensors ensure server availability
PRTG has several generic sensors to ensure server availability in both the SNMP and
WMI protocols:
- SNMP CPU Load Sensor
- Windows CPU Load Sensor
- SNMP Hardware Status Sensor
- SNMP Memory Sensor
- WMI Memory Sensor
The SNMP Windows Server sensor and the WMI Service Sensor are both monitoring if a windows service stops and can restart it for you ensuring the continuity of your critical windows server services.
The WSUS Statistic Sensor gives you peace of mind that your Windows servers have received their critical patches.
![]() A server is a computer or system that provides resources, data, services, or programs to other computers, known as clients, over a network. In theory, whenever computers share resources with client machines they are considered servers. There are many types of servers, including web servers, mail servers, and virtual servers.
A server is a computer or system that provides resources, data, services, or programs to other computers, known as clients, over a network. In theory, whenever computers share resources with client machines they are considered servers. There are many types of servers, including web servers, mail servers, and virtual servers.
Read more

“Server availability leads to service availability – PRTG Network Monitor covers your end to end server monitoring lending to uptime and business reliability. I like PRTG Network Monitor because all server availability monitoring needs are met in one tool – from the hardware platform, to critical services monitoring to the business processes that run on Windows servers.”
Heather Pacan is Senior Systems Engineer at PAESSLER AG.
500,000 administrators worldwide
trust in our software.

“Fantastic network and infrastructure monitoring solution that is easy to deploy and easier still to use. Simply the best available.”

“Software is absolutely perfect, Support is superior. Meets all needs and requirements, this is a must have solution if you are needing any form of monitoring.”

“The tool excels at its primary focus of being a unified infrastructure management and network monitoring service.”
- Unlimited version of PRTG for 30 days
- After 30 days, PRTG reverts to a free version
- Or, you can upgrade to a paid license anytime


“Our network engineers really love PRTG, because of its customization”
John Krull, CTO, Oakland Unified School District, USA
“Easy to implement and configure with good technical support.”
R. v. S., ICT Manager at Heinen & Hopman Eng BV
We asked: would you recommend PRTG?
Over 95% of our customers say yes!
Paessler conducted trials in over 600 IT departments worldwide to tune its network monitoring software closer to the needs of sysadmins.
The result of the survey: over 95% of the participants would recommend PRTG – or already have.

PRTG makes your job easier
Our monitoring software frees you to focus on other tasks by promptly notifying you of potential issues.
![]()
Save effort
PRTG gives you one central monitoring tool for your servers and entire network. Enjoy a quick overview of your whole infrastructure via our dashboard and app.
![]()
Save time
Getting started with PRTG is a breeze. Setting up or switching from another network monitoring tool is easy thanks to the auto-discovery and pre-configured device templates.
![]()
Save money
80% of our customers report substantial cost savings with network monitoring. Your costs of licenses will likely pay for themselves within weeks.

PRTG: The multi-tool for sysadmins
Adapt PRTG individually and dynamically to your needs and rely on a strong API:- HTTP API: Access monitoring data and manipulate monitoring objects via HTTP requests
- Custom sensors: Create your own PRTG sensors for customized monitoring
- Custom notifications: Create your own notifications and send action triggers to external systems
- REST Custom sensor: Monitor almost everything that provides data in XML or JSON format

Also interesting:
Server Room Monitoring: PRTG reliably secures the server room and monitors temperature fluctuations, humidity, power outages, and server health.
PRTG checks your hard disks and displays all memory capacities on one dashboard. Monitoring of NAS devices of vendors like Synology or Storage Area Networks (SAN) is also possible.
Keep an eye on your network and monitor all your computers, devices like printers or routers, your MySQL-Databases, and your websites.
Packet Capture: PRTG analyzes data packets and displays the data packet loss rate. In the event a critical value is exceeded, you’ll automatically receive an alert.
Still not convinced?
![]()
More than 500,000 sysadmins love PRTG
Paessler PRTG is used by companies of all sizes. Sysadmins love PRTG because it makes their job a whole lot easier.
Still not convinced?
![]()
Monitor your entire IT infrastructure
Bandwidth, servers, virtual environments, websites, VoIP services – PRTG keeps an eye on your entire network.
![]()
Try Paessler PRTG for free
Everyone has different monitoring needs. That’s why we let you try PRTG for free. Start now with your trial.
|
PRTG |
Network Monitoring Software - Version 24.3.98.1210 (July 31st, 2024) |
|
Hosting |
Download for Windows and cloud-based version PRTG Hosted Monitor available |
Languages |
English, German, Spanish, French, Portuguese, Dutch, Russian, Japanese, and Simplified Chinese |
Pricing |
Up to 100 sensors for free (Price List) |
Unified Monitoring |
Network devices, bandwidth, servers, applications, virtual environments, remote systems, IoT, and more |
Supported Vendors & Applications |
|