![]()
All-in-one router
monitoring software PRTG

Check bandwidth consumption, network traffic, error messages of your routers with PRTG
Router monitoring via SNMP, Packet Sniffer, NetFlow/sflow/jFlow
PRTG detects and monitors suspicious traffic in your home or enterprise
All-in-one router monitoring software PRTG
Prevent network failures and bottlenecks with PRTG router monitoring
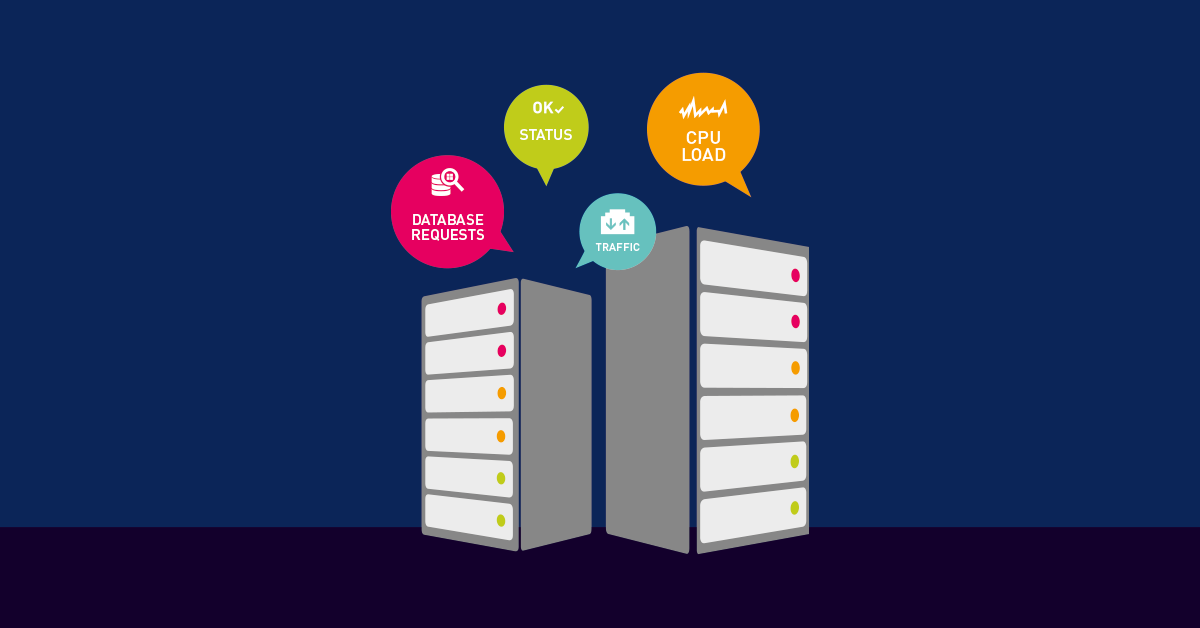
Overloaded routers (and thus networks) can slow down a company's communication and workflow.
PRTG Network Monitor, our network monitoring solution, allows you to check all your router connections. Determine how much bandwidth is used per connection, the devices, programs, or users which generate the most traffic, and where bottlenecks occur in your network. You'll get a ton of valuable information which will make your work as an administrator that much easier. PRTG supports routers from all the major manufacturers like Cisco, Dell, Yamaha, Linksys, TP Link or Netgear.
With its wide range of features, PRTG Network Monitor makes it easy to monitor your router traffic around the clock, log network activities, and calculate network utilization.
Along with traffic and bandwidth, you can also monitor the device itself. PRTG lets you keep a constant eye on computer fans, temperatures, and power supplies, as well as the memory of your router. And thanks to PRTG, you can even stay up-to-date on the status and statistics of your VPN connection.
You'll be notified automatically whenever something seems amiss inside your router or network traffic. PRTG lets you act quickly to prevent bandwidth bottlenecks from paralyzing your network.
Thanks to PRTG, the entire staff can work with peace of mind.
Here's what monitoring looks like in PRTG

Your network and devices at a glance
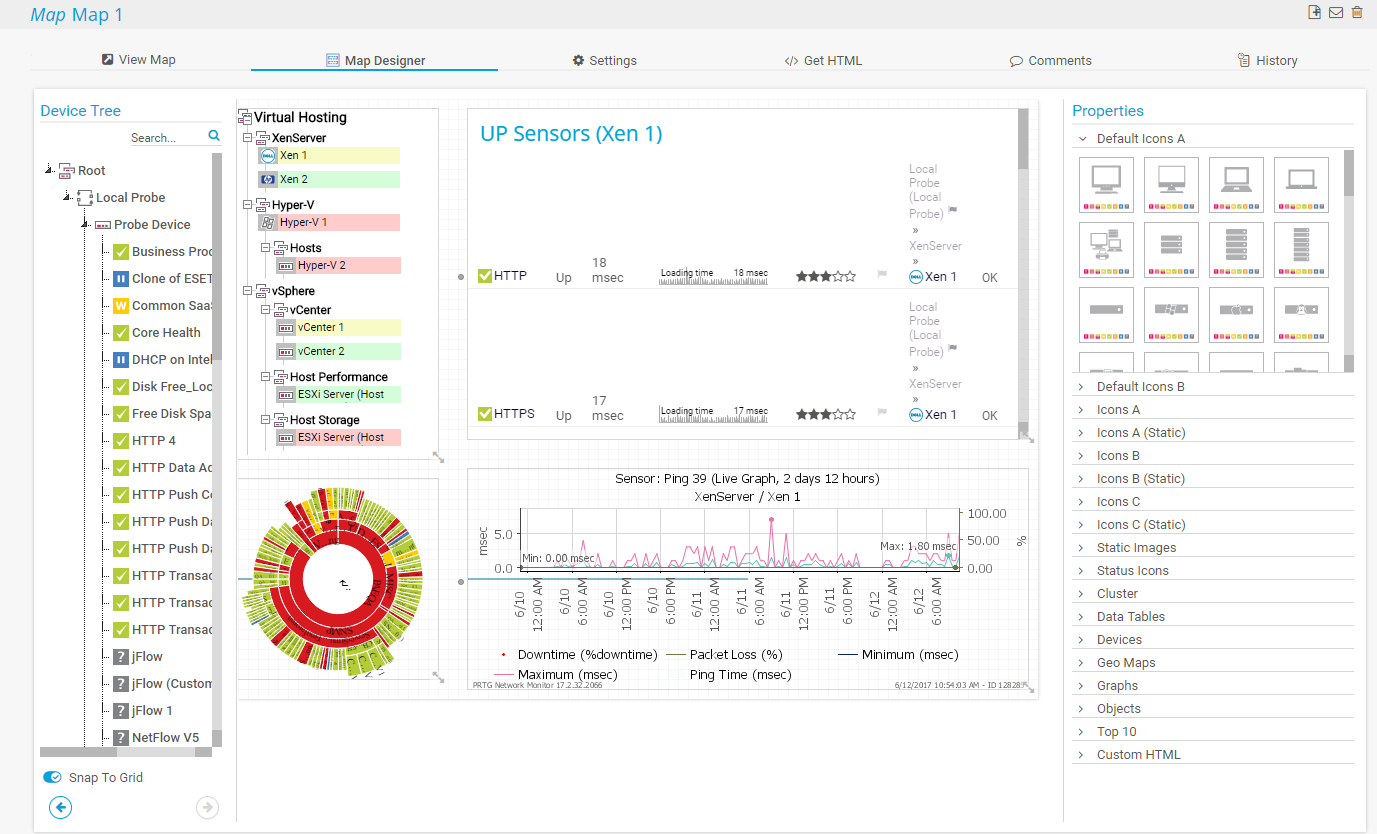
Create individual graphical maps

The PRTG Sunburst View

“I particularly like having breakfast at home and just surveying my domain, and understanding what's working and what isn't.”
Steve Coppin, Oxford University
Router monitoring with PRTG
Router checking with PRTG supports three methods which come with their own advantages and disadvantages:
![]() NetFlow is a protocol for collecting, aggregating and recording traffic flow data in a network. NetFlow data provide a more granular view of how bandwidth and network traffic are being used than other monitoring solutions, such as SNMP. NetFlow was developed by Cisco and is embedded in Cisco’s IOS software on the company’s routers and switches and has been supported on almost all Cisco devices since the 11.1 train of Cisco IOS Software.
NetFlow is a protocol for collecting, aggregating and recording traffic flow data in a network. NetFlow data provide a more granular view of how bandwidth and network traffic are being used than other monitoring solutions, such as SNMP. NetFlow was developed by Cisco and is embedded in Cisco’s IOS software on the company’s routers and switches and has been supported on almost all Cisco devices since the 11.1 train of Cisco IOS Software.
Read more
![]()
SNMP
The network protocol SNMP is the easiest way to calculate traffic. CPU and network loads remain low. However, it is not possible to analyze protocols or IP addresses.
![]()
Packet Sniffer
A built-in PRTG Packet Sniffer lets you examine all network data packets for protocols or IP addresses. But of the three methods, this one generates the highest CPU and network load.
![]()
Netflow/sflow/jFlow
The NetFlow/sflow/jFlow/IPFIX methods belong to the routers of certain providers such as Cisco, HP, or Juniper. Bandwidth utilization is calculated within each device and transmitted to PRTG for analysis and disclosure. The most powerful of the three alternatives when both CPU and network loads are low, this method is especially suitable for networks with a great deal of traffic.
Router monitoring sensors
The following sensors can also be used for router monitoring with PRTG:
Cisco ADSL
Monitors ADSL statistics of a Cisco router using SNMP. It can show:
- Speed of downlink and uplink
- Remote and local attenuation, SNR and local power output
Packet Sniffer
Monitors the headers of data packets that pass a local network using a built-in packet sniffer. It can show the following traffic types (analyzes only header traffic!):
- Chat (IRC, AIM)
- Citrix
- FTP/P2P
- Mail, WWW
- Remote control (RDP, SSH, Telnet, VNC)
SNMP Traffic
The SNMP Traffic sensor monitors traffic on a device using SNMP. PRTG creates one traffic sensor for each individual port
Net Flow V5
Shows traffic for NetFlow v5-supported devices, split by type and is able to divide traffic into channels. Traffic types include:
- Chat (IRC, AIM)
- Citrix
- FTP/P2P
- Mail, WWW
- Remote control (RDP, SSH, Telnet, VNC)
NetFlow V9
Shows traffic for NetFlow v9-supported devices, split by type and is able to divide traffic into channels. Traffic types include:
- Chat (IRC, AIM)
- Citrix
- FTP/P2P
- Mail, WWW
- Remote control (RDP, SSH, Telnet, VNC)
IPFIX
Shows traffic for IPFIX-supported devices, split by type and is able to divide traffic into channels. Traffic types include:
- Chat (IRC, AIM)
- Citrix
- FTP/P2P
- Mail, WWW
- Remote control (RDP, SSH, Telnet, VNC)
jFlow
Shows traffic for jFlow-supported devices, split by type and is able to divide traffic into channels. Traffic types include:
- Chat (IRC, AIM)
- Citrix
- FTP/P2P
- Mail, WWW
- Remote control (RDP, SSH, Telnet, VNC)
sFlow
Shows traffic for sFlow-supported devices, split by type and is able to into channels. Traffic types include:
- Chat (IRC, AIM)
- Citrix
- FTP/P2P
- Mail, WWW
- Remote control (RDP, SSH, Telnet, VNC)
Trusted by 500,000 users and recognized
by industry analysts as a leader

“Fantastic network and infrastructure monitoring solution that is easy to deploy and easier still to use. Simply the best available.”

“Software is absolutely perfect, Support is superior. Meets all needs and requirements, this is a must have solution if you are needing any form of monitoring.”

“The tool excels at its primary focus of being a unified infrastructure management and network monitoring service.”
How to monitor router traffic
Here's a quick summary about how to monitor router traffic with PRTG:
![]()
Configure and run PRTG Network Monitor.
![]()
Choose one of following options for router monitoring protocols according to your router specifications: SNMP, NetFlow/jFlow/sFlow or Packet Sniffing.
![]()
See the bandwidth consumption of individual connections and all network activities at a glance and create individual dashboards.
![]()
Set up custom alarms and you’ll be notified in case of router errors or overloads.
PRTG makes your job easier
Our monitoring software frees you to focus on other tasks by promptly notifying you of potential issues.
![]()
Save effort
PRTG gives you one central monitoring tool for your servers and entire network. Enjoy a quick overview of your whole infrastructure via our dashboard and app.
![]()
Save time
Getting started with PRTG is a breeze. Setting up or switching from another network monitoring tool is easy thanks to the auto-discovery and pre-configured device templates.
![]()
Save money
80% of our customers report substantial cost savings with network monitoring. Your costs of licenses will likely pay for themselves within weeks.
Prevent network failures and bottlenecks with PRTG router monitoring
![]() Bandwidth is measured as the amount of data that can be transferred from one point to another within a network in a specific amount of time. Typically, bandwidth is expressed as a bitrate and measured in bits per second (bps). It refers to the transmission capacity of a connection and is an important factor when determining the quality and speed of a network.
Bandwidth is measured as the amount of data that can be transferred from one point to another within a network in a specific amount of time. Typically, bandwidth is expressed as a bitrate and measured in bits per second (bps). It refers to the transmission capacity of a connection and is an important factor when determining the quality and speed of a network.
Read more
![]()
Immediately know the score
PRTG provides automatic alerts when the network crashes or protocol errors take place.
![]()
Fix bugs quickly
Meet problems head-on to prevent your network from crashing.
![]()
Optimize bandwidth consumption
By adjusting available bandwidth to meet demand and reducing unnecessary traffic, you'll create more stable connections.
Speed up company processes - an optimized bandwidth allows for a company's operations to run quickly. Enjoy an increase in the availability of services and applications.
![]()
Traffic transparency
With PRTG, you'll receive and be able to analyze information regarding the intensity of traffic across individual connections.
![]()
Greater security
Use PRTG to detect suspicious traffic, which is indicative of malware.
Monitor hardware, performance and other details of your routers
In addition to the traffic running through your router and bandwidth, you can also monitor the device itself. With PRTG, you can always keep an eye on the fan, temperature, power supplies or memory of your router. PRTG also keeps you informed about the status and statistics of your VPN connection.
Modem monitoring with PRTG
PRTG allows you to monitor all performance parameters of your network modem and to ensure a stable internet connection for your company.
Modem monitoring includes the following use cases:
- Check the Quality of Service (QoS) of your internet connection
- Check if your ISP provides you with the bandwidth you are paying for
- Detect unwanted traffic or other security issues
“Easy to implement and configure with good technical support.”
R. v. S., ICT Manager at Heinen & Hopman Eng BV
Create innovative solutions with Paessler’s partners
Partnering with innovative vendors, Paessler unleashes synergies to create
new and additional benefits for joined customers.

With the combination of PRTG and Insys, the monitoring specialist Paessler and the industrial gateway manufacturer INSYS icom offer a practical possibility to merge IT and OT.
INSYS icom

We asked: would you recommend PRTG?
Over 95% of our customers say yes!
Paessler conducted trials in over 600 IT departments worldwide to tune its network monitoring software closer to the needs of sysadmins.
The result of the survey: over 95% of the participants would recommend PRTG – or already have.


PRTG: The multi-tool for sysadmins
Adapt PRTG individually and dynamically to your needs and rely on a strong API:- HTTP API: Access monitoring data and manipulate monitoring objects via HTTP requests
- Custom sensors: Create your own PRTG sensors for customized monitoring
- Custom notifications: Create your own notifications and send action triggers to external systems
- REST Custom sensor: Monitor almost everything that provides data in XML or JSON format
|
PRTG |
Network Monitoring Software - Version 24.3.98.1210 (July 31st, 2024) |
|
Hosting |
Download for Windows and cloud-based version PRTG Hosted Monitor available |
Languages |
English, German, Spanish, French, Portuguese, Dutch, Russian, Japanese, and Simplified Chinese |
Pricing |
Up to 100 sensors for free (Price List) |
Unified Monitoring |
Network devices, bandwidth, servers, applications, virtual environments, remote systems, IoT, and more |
Supported Vendors & Applications |
|