![]()
Monitor your network utilization
and prevent network problems

PRTG provides sensors for
measuring your network activity
PRTG shows you
unusual network activity
PRTG monitors the
performance of your networks
PRTG identifies the devices
that generate high traffic
What is network utilization?
Network utilization is the proportion of the current network traffic to the maximum amount of traffic that can be handled. It indicates the bandwidth consumption in the network. While high network traffic means that the network is overloaded, low network traffic means that the network is not busy. If the network load reaches or exceeds the threshold under normal conditions, this will result in low network speed, interruptions, timeouts, etc. The network load is an indicator of the network utilization.
Why is PRTG the ideal solution for monitoring your network utilization?
PRTG Network Monitor is the ideal tool to display and monitor the network utilization in your network. PRTG is easy to install and helps to detect vulnerabilities in your network. Especially if you have distributed locations, it is important to have an overview of the utilization of the WAN routes to be able to act quickly in case of high network utilization. This way, you can prevent timeouts or even complete network downtime.
5 problems that might arise when network utilization is too high
![]()
Slow file access
If the network has a high load, access to centrally stored data becomes slow or even impossible. For smaller files, the impact is rather small, but especially for applications that work with very large files, access becomes almost impossible.
![]()
Database problems
If files are stored in databases, for example, timeouts can occur when the network load is high, and the files cannot be opened.
![]()
Limited internet access
The PRTG dashboard provides a quick overview, any time you like. You will immediately see if everything is alright. The dashboard is customizable to meet all your specific needs. While away from your desk – such as when working in the server room – PRTG can be accessed via smartphone apps so you never miss a beat.
![]()
Interrupted IP / video telephony
Especially for IP telephony, a sufficiently high amount of bandwidth is essential. If this is not available due to excessive network load, interruptions may occur. Video calls are then no longer possible in most cases.
![]()
Delayed or aborted backups
Data backups always generate a high network load. However, if your network is already very busy, the backups may be delayed or even aborted.
By monitoring your network utilization with PRTG, you prevent all these problems and lay the foundation for your network, applications, and services to be highly performant.
How PRTG prevents these problems
![]()
Network utilization monitoring
To avoid high load on your network, you are recommended to monitor it. While monitoring alone will not optimize your network, it does give you an overview of potential vulnerabilities. PRTG Network Monitor is perfectly suited for this. You can use it to analyze your network and make insightful decisions.
![]()
Identify problems
The next step is to identify servers, clients, or other devices on your network that are causing high network utilization. In addition, applications such as backup solutions, which are configured incorrectly, can cause this.
![]()
Optimize your network
After identifying what is causing a high load on your network, you can now adjust this. For example, prioritize applications or configure backups to start in the evening hours. A VLAN can also help.
Sensors
PRTG provides a number of sensors that,
depending on the network configuration, help you detect problems
SNMP Traffic
The SNMP Traffic sensor monitors traffic on a device using the Simple Network Management Protocol (SNMP). You can create it on a device that provides traffic data. PRTG creates one traffic sensor for each individual port.
Packet Sniffer
The Packet Sniffer sensor monitors the headers of data packets that pass a local network card using a built-in packet sniffer. You can choose from predefined channels. The sensor analyzes only header traffic.
SNMP RMON sensor
The SNMP RMON sensor monitors traffic on a device using the Remote Monitoring (RMON) standard SNMP. You can create it on an SNMP-compatible device that provides traffic data via RMON. Depending on the data that your device returns, PRTG displays traffic data for each port in different channels, which allows a detailed analysis. If available, the sensor queries 64-bit counters.
jFlow v5 sensor
The jFlow v5 sensor receives traffic data from a jFlow v5-compatible device and shows the traffic by type. Several filter options are available to divide traffic into different channels.
NetFlow V5 sensor
The NetFlow v5 sensor receives traffic data from a NetFlow v5-compatible device and shows the traffic by type. Ensure that the sensor matches the NetFlow version that your device exports. Several filter options are available to divide traffic into different channels.
![]() How PRTG defines sensors
How PRTG defines sensors
In PRTG, “sensors” are the basic monitoring elements. One sensor usually monitors one measured value in your network, e.g. the traffic of a switch port, the CPU load of a server, the free space of a disk drive. On average you need about 5-10 sensors per device or one sensor per switch port.
What PRTG looks like
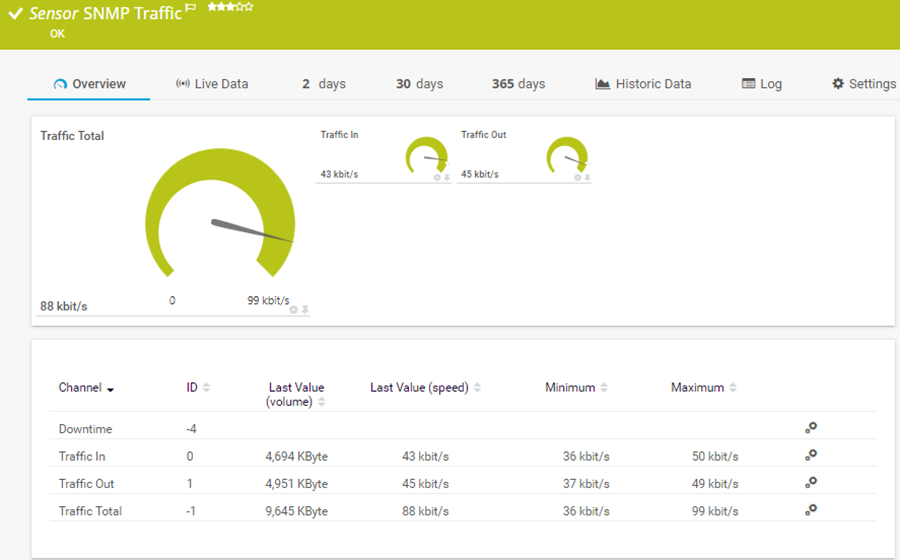
SNMP Traffic Sensor
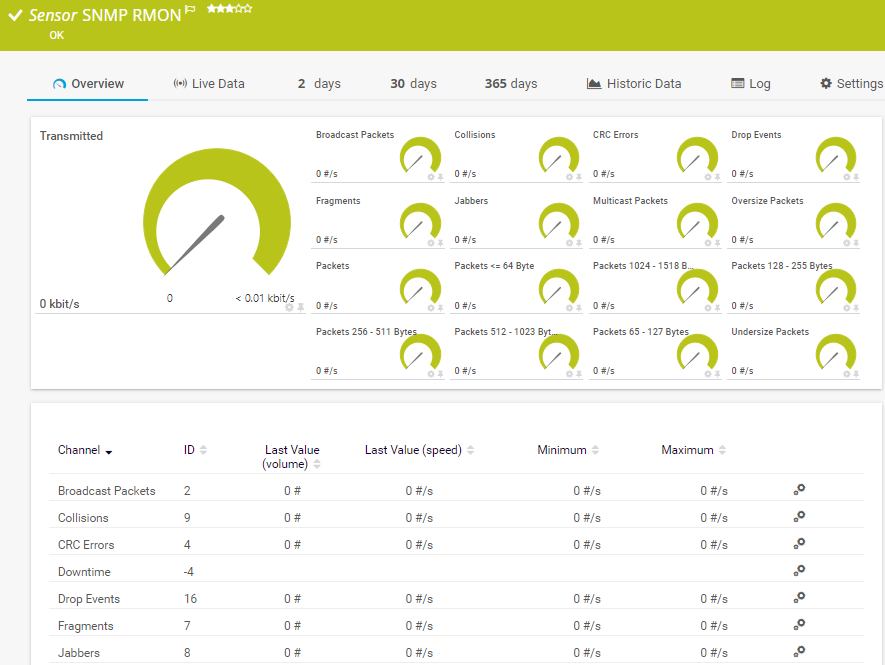
Sensor SNMP RMON
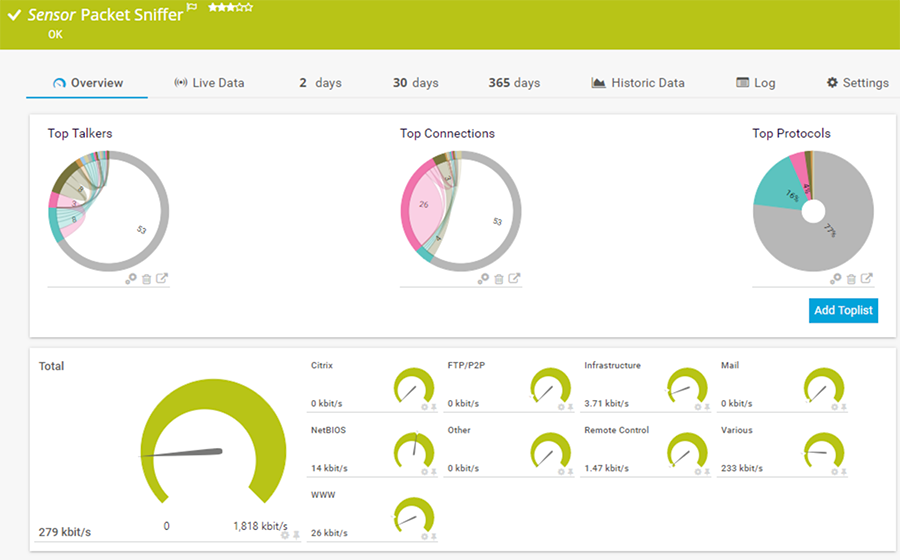
Packet Sniffer Sensor
Create innovative solutions with Paessler’s partners
Partnering with innovative vendors, Paessler unleashes synergies to create
new and additional benefits for joined customers.


UVnetworks
UVexplorer integrates tightly with PRTG to bring fast and accurate network discovery, detailed device inventory, and automatic network mapping to the PRTG platform.
PRTG can do more
![]()
Show unusual
network utilization
PRTG not only informs you about high network usage but can also inform you about unusually high utilization. This way you can act before it happens.
![]()
Be
informed
PRTG will alert you via email, SMS, push message, ... if a predefined or custom limit value is reached.
![]()
All
inclusive
PRTG comes with predefined sensors for many manufacturers you can use out of the box, an alerting system, and technical support. If you opt for a license, you’ll get access to its full range of features. Only the number of sensors is limited.
PRTG in a nutshell
PRTG monitors your entire IT infrastructure
Use PRTG to monitor, for example, network traffic, applications, bandwidth, cloud services, databases, virtual environments, availability & uptime, ports, IP addresses, hardware status, network security, web services, and much more.
PRTG supports the most important technologies
Monitor your network for example via SNMP, flow protocols (NetFlow, jFlow, sFlow, IPFIX), SSH, WMI, or ping. PRTG also supports technologies used in Industrial IT & OT environments, such as OPC UA, MQTT, or Modbus. Use the powerful PRTG API for custom integrations (for example via Python, PowerShell, or REST).
PRTG can be used for any operating system
Download and install PRTG Network Monitor on a Windows system or use our cloud-based product PRTG Hosted Monitor for all other operating systems. What’s more: our native PRTG Desktop application runs on Windows or macOS – for even quicker access & multi-server views.
Still not convinced?
![]()
More than 500,000 sysadmins love PRTG
Paessler PRTG is used by companies of all sizes. Sysadmins love PRTG because it makes their job a whole lot easier.
Still not convinced?
![]()
Monitor your entire IT infrastructure
Bandwidth, servers, virtual environments, websites, VoIP services – PRTG keeps an eye on your entire network.
![]()
Try Paessler PRTG for free
Everyone has different monitoring needs. That’s why we let you try PRTG for free. Start now with your trial.
Combining the broad monitoring feature set of PRTG with IP Fabric’s automated network assurance creates a new level of network visibility and reliability.