![]()
Network troubleshooting with PRTG:
Discover causes, solve problems

Use sensors to narrow down
possible causes
Avoid problems in the future
Solve network problems
in 3 easy steps
Network troubleshooting: Now and in the future
Now: Solve network problems quickly
Errors, disruptions, failures...all network problems are serious. When a network problem occurs, the technical support department gets inundated with complaints, most of which are vague at best (“My connection is down”). The cause is often unknown – and can lie in many different places. Network devices, bandwidth, applications, security software? For admins, the stress has just begun.
How PRTG can help: Our network monitoring software helps you narrow down the search. Its sensors provide information and clues that enable you to quickly exclude certain causes.
In the future: Avoid network problems
The more complex the IT infrastructure, the more vulnerable it is to errors. Sooner or later, sysadmins have to find a way to maintain the performance and availability of their network. To do so, they need a constant overview of the network’s processes and components.
How PRTG can help: PRTG monitors your IT infrastructure 24 hours per day, 7 days a week. With PRTG, you’ll immediately recognize unusual network loads and minor malfunctions, and can intervene before real problems arise.
Sensors to help you take control of your network
The staples
The SNMP Traffic Sensor, NetFlow v5 Sensor, Packet Sniffer Sensor, SNMP CPU Load Sensor, and WMI Memory Sensor are the five most widely used PRTG sensors. These sensors will tell you if your devices are working properly and provide you with detailed traffic data filtered by IP address, protocol, application, and more. As a result, they help speed up the troubleshooting process.
250+ sensors:
With PRTG, you get access to over 250 preconfigured sensors for everything from hardware, applications, cloud services, and the quality of service of your VoIP. You also get customizable, user-defined sensors.
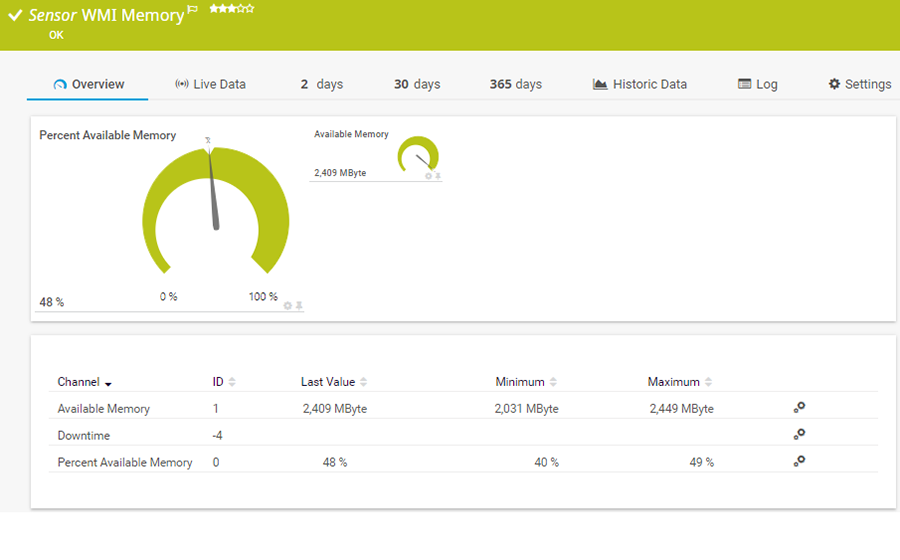
![]() How PRTG defines sensors
How PRTG defines sensors
In PRTG, “sensors” are the basic monitoring elements. One sensor usually monitors one measured value in your network, e.g. the traffic of a switch port, the CPU load of a server, the free space of a disk drive. On average you need about 5-10 sensors per device or one sensor per switch port.
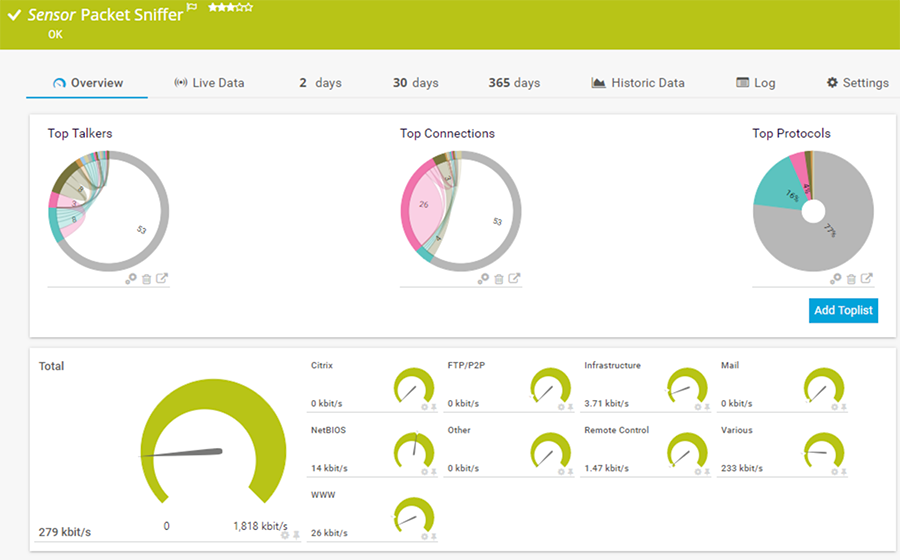
Packet Sniffer Sensor
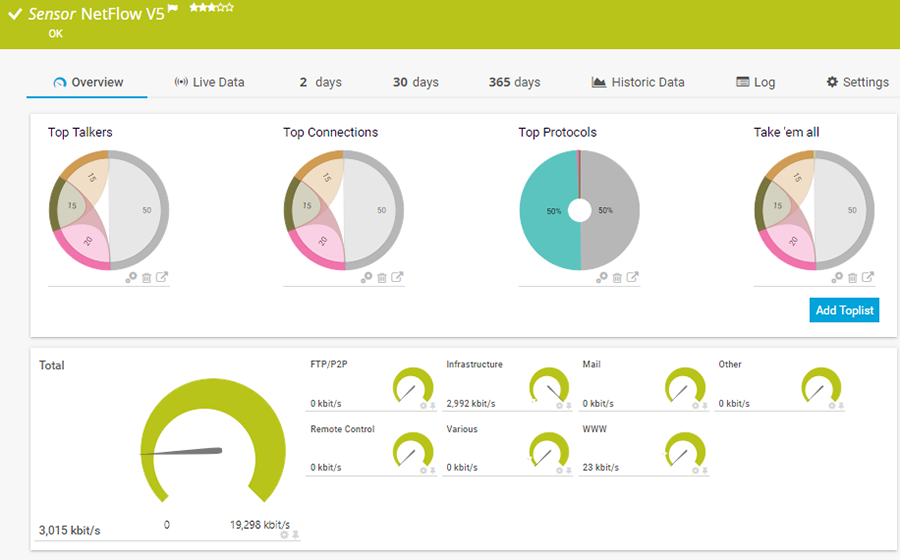
NetFlow V5 Sensor
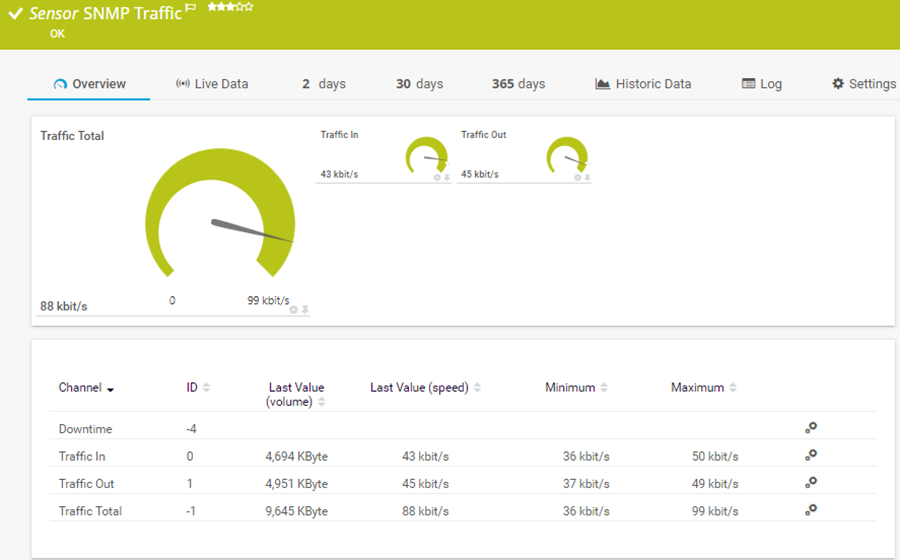
SNMP Traffic Sensor
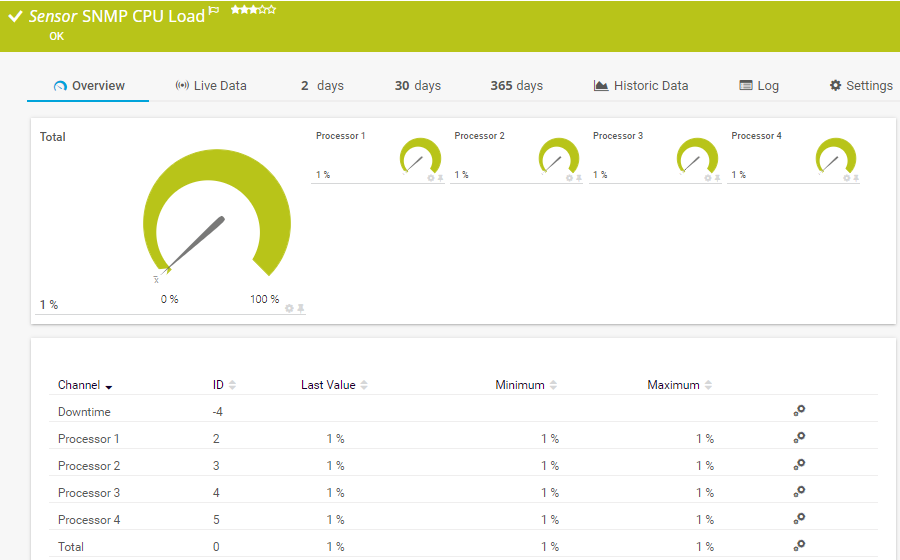
SNMP CPU Load Sensor
WMI Memory Sensor
PRTG makes your job easier
Our monitoring software frees you to focus on other tasks by promptly notifying you of potential issues.
![]()
Save effort
PRTG gives you one central monitoring tool for your servers and entire network. Enjoy a quick overview of your whole infrastructure via our dashboard and app.
![]()
Save time
Getting started with PRTG is a breeze. Setting up or switching from another network monitoring tool is easy thanks to the auto-discovery and pre-configured device templates.
![]()
Save money
80% of our customers report substantial cost savings with network monitoring. Your costs of licenses will likely pay for themselves within weeks.
3 steps to effective network troubleshooting:
![]()
Step 1:
Identify the problem
Easier said than done – sysadmins must be able to recognize the problem in the first place. Most network errors are overlooked until they become critical and cause more serious disruptions. Time is therefore of the essence. The quicker you spot a problem, the better. To do so, you’ll need an overview of your entire network.
![]()
Step 2:
Discover the causes
More often than not, IT managers start out by entering commands such as ping, traceroute, IPconfig, and netstat in their Windows command line. These commands can root out the whereabouts of possible causes in a matter of seconds. Otherwise, you’ll need to start searching for more comprehensive network troubleshooting tools or start checking if there are connectivity issues like problems with the internet configuration.
![]()
Step 3:
Solve the problem
Every network problem can be traced to an underlying cause. For example: A hard drive running at full capacity can cause a server to fail. Neglecting to update a switch can cause the switch to malfunction and lead to disruptions in network traffic. Faulty network settings and external attacks are also common culprits. A reboot is the most popular solution to these problems. And while they are often effective, reboots do not address the underlying causes of problems.
Inside PRTG: A sneak peek at our network troubleshooting flowchart
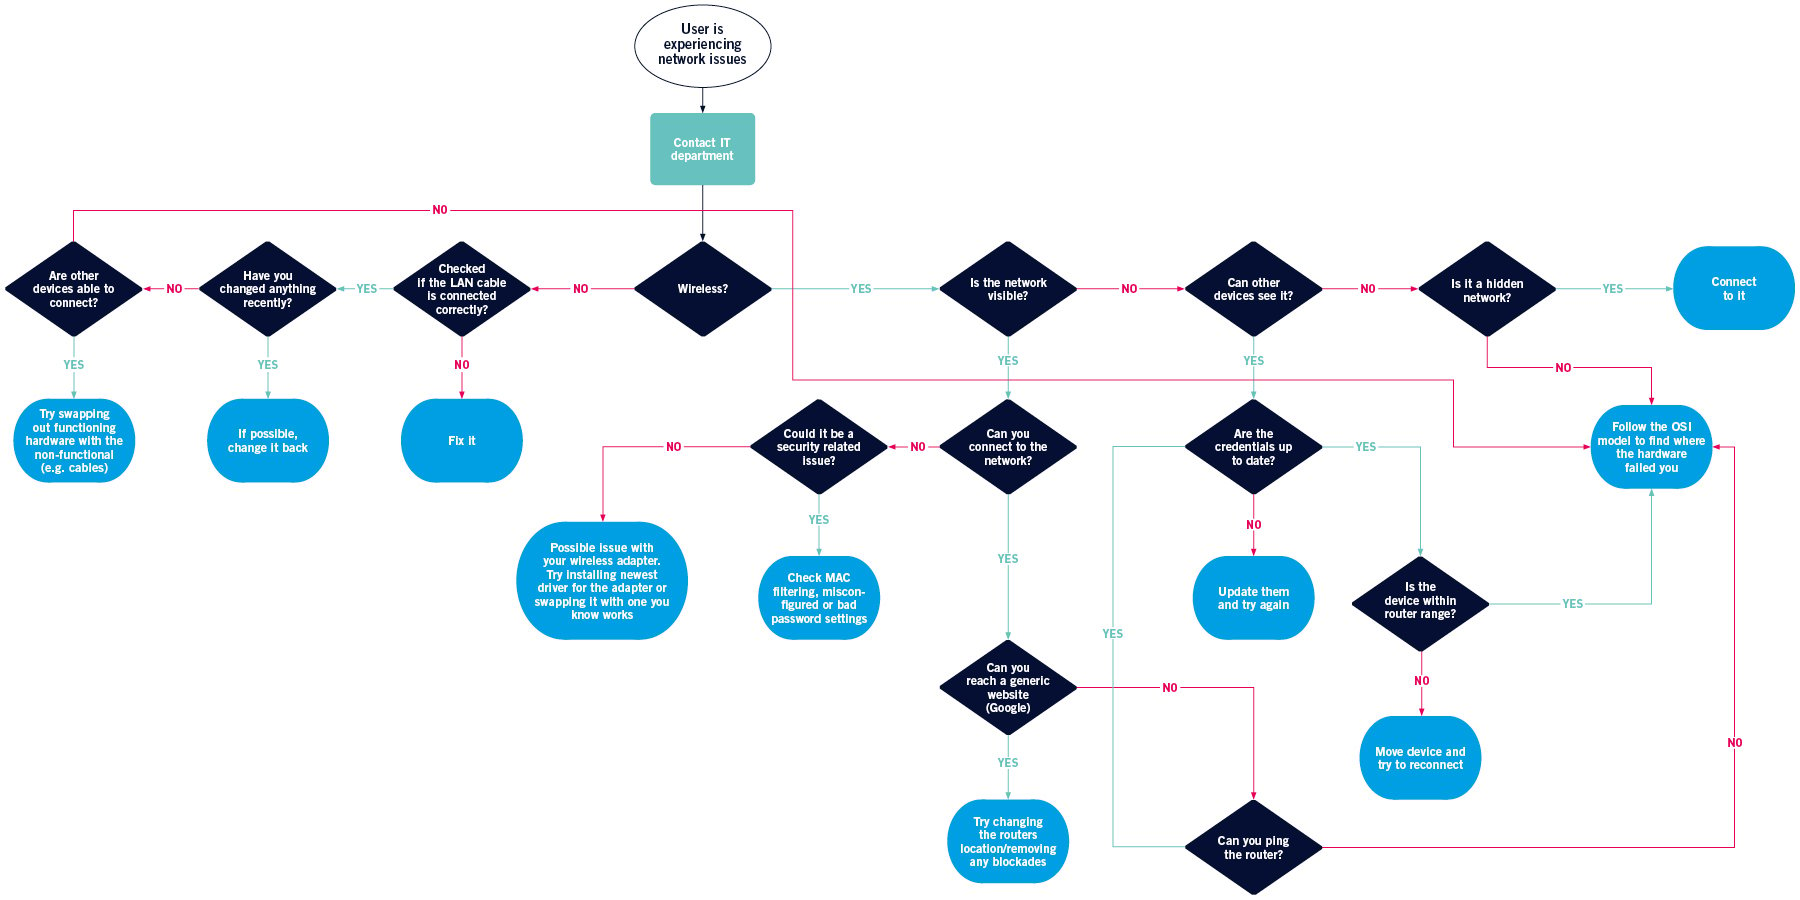

“The consistent use of troubleshooting flowcharts allows us to standardize the troubleshooting process and keep downtime to a minimum.”
Sascha Neumeier, Paessler IT Department
Trusted by 500,000 users and recognized
by industry analysts as a leader
by industry analysts as a leader

“Fantastic network and infrastructure monitoring solution that is easy to deploy and easier still to use. Simply the best available.”

“Software is absolutely perfect, Support is superior. Meets all needs and requirements, this is a must have solution if you are needing any form of monitoring.”

“The tool excels at its primary focus of being a unified infrastructure management and network monitoring service.”
3 blog articles to help you sniff out network errors
A sneak peek at network troubleshooting with PRTG
![]()
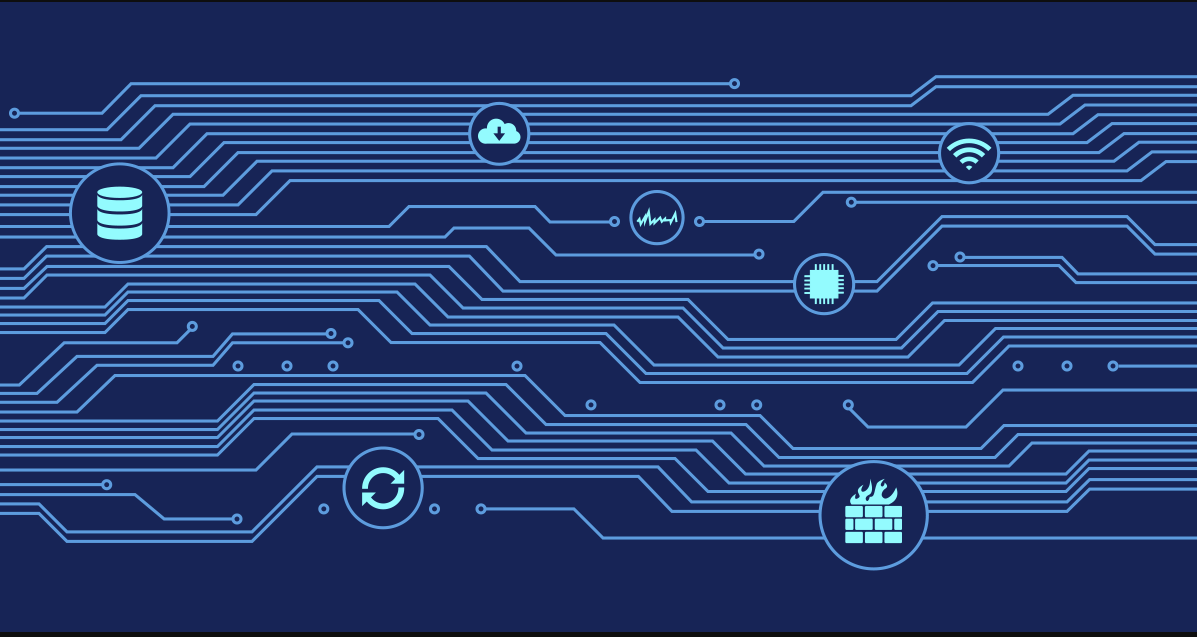
An eye on all your hardware
Server problems, faulty switches, router disruptions...PRTG lets you keep an eye on all your hardware. Our software comes with preconfigured sensors for all the biggest manufacturers, as well as customizable, user-defined sensors.
![]()
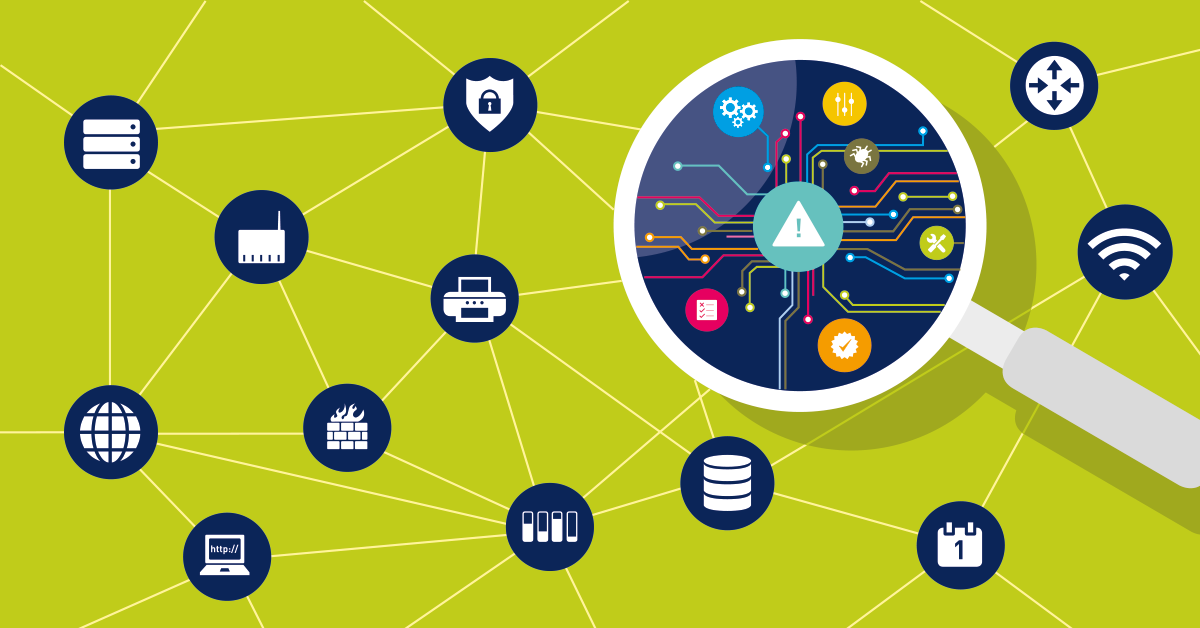
All in one
PRTG is an all-in-one monitoring software. You get access to all types of sensors, the alarm, reports, and our many tutorials. PRTG is designed with all the features you'll need to monitor your entire network.
![]()
Free trial
Interested in testing our software and comparing it with other network troubleshooting tools? Please do! Give the full range of PRTG features and sensors a try for 30 days free of charge. After the trial period, continue using 100 sensors for as long as you want. You can also opt for a license based on the number of sensors required by your company.
Analysis: 2 devices that cause lots of problems
Switches
Many networks use switches from a variety of different manufacturers. At least some of these switches are inevitably outdated. All switches must be updated at some point or serviced in some other way. As a result, they are often at the root of problems. Switches tend to serve as bottlenecks and can lead to connectivity issues. If a switch malfunctions, the entire network can suffer. PRTG keeps a constant eye on your switches.
Routers
With routers, a similar problem arises. Networks use lots of different types of routers from lots of different manufacturers. If a router fails, your LAN and WLAN connections will immediately suffer. Individual ports can also be affected. PRTG monitors open and closed ports around the clock. If a port is affected, you’ll be notified at once.
11 tips for network monitoring (PDF)
Hardware problems, downtime, backups, performance issues: sysadmins are confronted with many different issues during the course of a day. In this PDF, we take a closer look at these issues and offer tips, strategies, and solutions. To the white paper


Other topics related to network troubleshooting
Syslog monitoring
Our network monitoring tool retrieves and analyzes syslog messages. If it comes across syslog events or error messages, you’ll be notified at once. More on syslog monitoring, including tutorials
Network diagnosis
Network diagnoses delve deeper into the troubleshooting process. There are several diagnosis tools on the market, including Wireshark. However, these tools tend to be highly specialized. With PRTG, you can rule out many error sources in advance. More on network diagnosis tools.
Website monitoring
Is your website taking more and more time to load? Is downtime becoming an issue? Or maybe certain functions are no longer working at all? PRTG monitors availability and other parameters to ensure your company’s website runs smoothly. More on website monitoring.

PRTG: The multi-tool for sysadmins
Adapt PRTG individually and dynamically to your needs and rely on a strong API:- HTTP API: Access monitoring data and manipulate monitoring objects via HTTP requests
- Custom sensors: Create your own PRTG sensors for customized monitoring
- Custom notifications: Create your own notifications and send action triggers to external systems
- REST Custom sensor: Monitor almost everything that provides data in XML or JSON format
Still not convinced?
![]()
More than 500,000 sysadmins love PRTG
Paessler PRTG is used by companies of all sizes. Sysadmins love PRTG because it makes their job a whole lot easier.
Still not convinced?
![]()
Monitor your entire IT infrastructure
Bandwidth, servers, virtual environments, websites, VoIP services – PRTG keeps an eye on your entire network.
![]()
Try Paessler PRTG for free
Everyone has different monitoring needs. That’s why we let you try PRTG for free. Start now with your trial.
|
PRTG |
Network Monitoring Software - Version 24.3.98.1210 (July 31st, 2024) |
|
Hosting |
Download for Windows and cloud-based version PRTG Hosted Monitor available |
Languages |
English, German, Spanish, French, Portuguese, Dutch, Russian, Japanese, and Simplified Chinese |
Pricing |
Up to 100 sensors for free (Price List) |
Unified Monitoring |
Network devices, bandwidth, servers, applications, virtual environments, remote systems, IoT, and more |
Supported Vendors & Applications |
|