![]()
Network jitter tests

Monitor network
jitter with PRTG
Keep a constant eye on
the quality of your VoIP
Receive prompt
jitter alerts

What’s network jitter?
Network jitter is the deviation from the average amount of time a data packet needs to travel from its starting point to its destination. High jitter values can cause noticeable delays and transmission errors (such as background noise and faulty audio signals), in particular when it comes to real-time services such as VoIP. No network is completely free of jitter. The important thing is that you keep jitter to a minimum.
Network jitter tests are a good way to check the quality of your connection. Among other things, these tests will help you determine whether your Internet Service Provider (ISP) is fulfilling the terms of your service level agreement (SLA), or if you need to increase your bandwidth.
Sensors for testing and monitoring jitter
![]() How PRTG defines sensors
How PRTG defines sensors
In PRTG, “sensors” are the basic monitoring elements. One sensor usually monitors one measured value in your network, e.g. the traffic of a switch port, the CPU load of a server, the free space of a disk drive. On average you need about 5-10 sensors per device or one sensor per switch port.
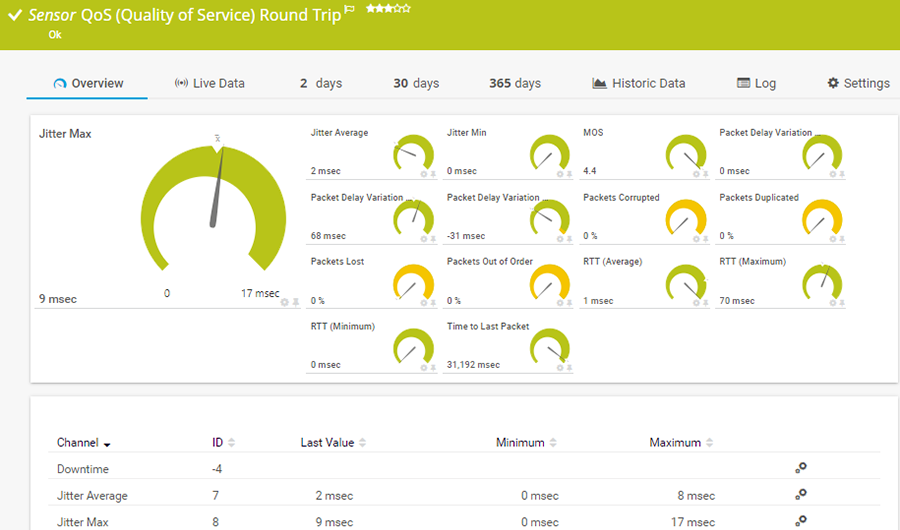
QoS (Quality of Service) Round Trip sensor
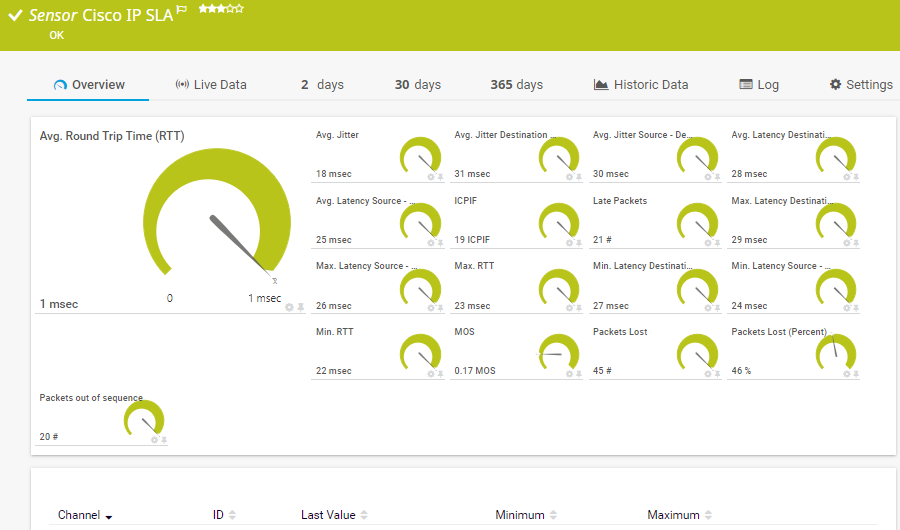
Cisco IP SLA sensor
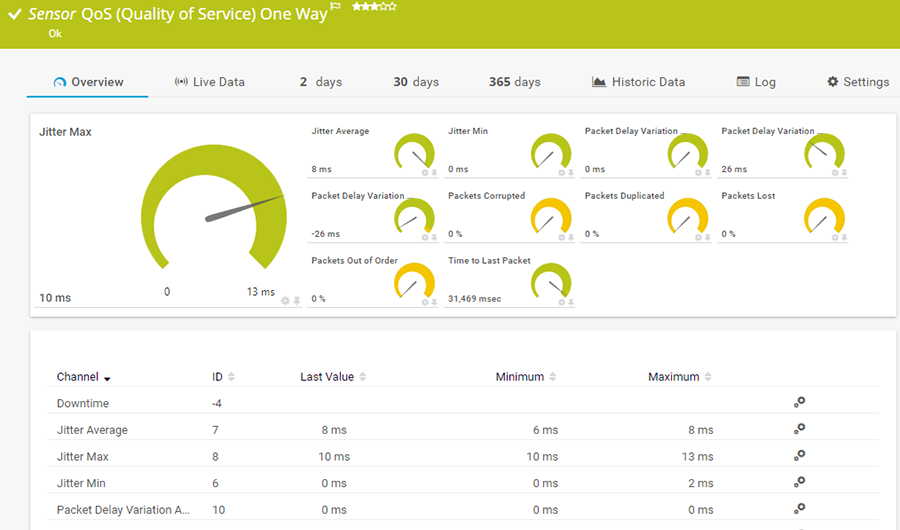
QoS (Quality of Service) One Way sensor
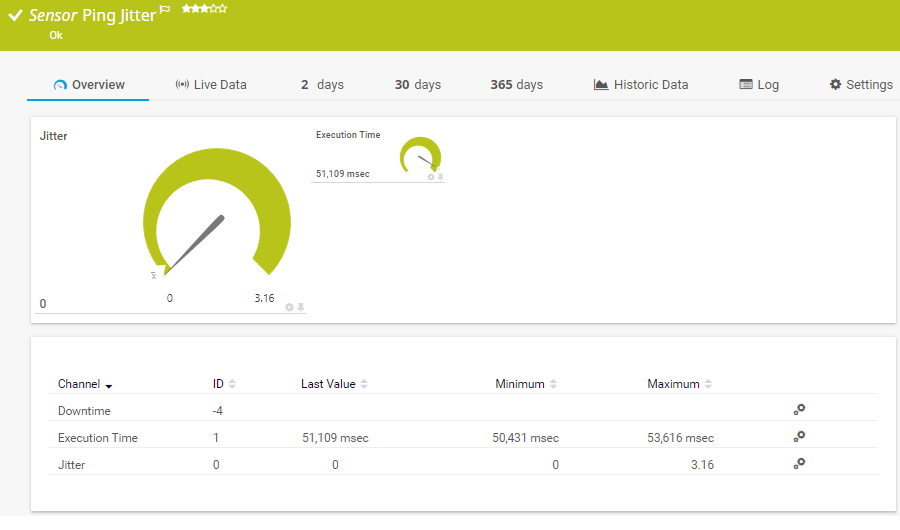
Ping Jitter sensor
Trusted by 500,000 users and recognized
by industry analysts as a leader
by industry analysts as a leader

“Fantastic network and infrastructure monitoring solution that is easy to deploy and easier still to use. Simply the best available.”

“Software is absolutely perfect, Support is superior. Meets all needs and requirements, this is a must have solution if you are needing any form of monitoring.”

“The tool excels at its primary focus of being a unified infrastructure management and network monitoring service.”
How to test for network jitter with PRTG
![]()
Create sensors
Create one or more of the four sensors mentioned above, such as the QoS (Quality of Service) Round Trip sensor. PRTG will automatically measure the deviation in the mean latency time and calculate this value as jitter (in accordance with RFC 3550).
![]()
Read the values
PRTG displays the minimum, maximum, and average fluctuation in latency time in milliseconds. For a more accurate reading, measure and record the value over longer periods of time. We recommend a jitter value of less than 20 milliseconds.
![]()
Take necessary actions
If your jitter value is too high, you might want to increase your bandwidth, but this of course will cost you more money. As an alternative, you can assign more bandwidth to VoIP and less to other data packets such as emails.
Advantages of continual jitter monitoring with PRTG
Stable VoIP
Many companies rely on stable VoIP connections to effectively conduct their business. By continually testing for network jitter, PRTG provides the stability these companies need. PRTG also keeps a constant eye on other VoIP-related data such as latency, packet loss, and ping times. If problems arise, you can take corrective actions at once.
Prompt alerts
You can set up custom notifications for each of the sensors you create in PRTG. If one of your threshold values is exceeded, you’ll receive an alert via SMS, email, or the PRTG app. Most of the time, you’ll be able to take action before disruptions or malfunctions arise.
Create innovative solutions with Paessler’s partners
Partnering with innovative vendors, Paessler unleashes synergies to create
new and additional benefits for joined customers.


With ScriptRunner, Paessler integrates a powerful event automation platform into PRTG Network Monitor.
ScriptRunner
PRTG in a nutshell
PRTG monitors your entire IT infrastructure
Use PRTG to monitor, for example, network traffic, applications, bandwidth, cloud services, databases, virtual environments, availability & uptime, ports, IP addresses, hardware status, network security, web services, and much more.
PRTG supports the most important technologies
Monitor your network for example via SNMP, flow protocols (NetFlow, jFlow, sFlow, IPFIX), SSH, WMI, or ping. PRTG also supports technologies used in Industrial IT & OT environments, such as OPC UA, MQTT, or Modbus. Use the powerful PRTG API for custom integrations (for example via Python, PowerShell, or REST).
PRTG can be used for any operating system
Download and install PRTG Network Monitor on a Windows system or use our cloud-based product PRTG Hosted Monitor for all other operating systems. What’s more: our native PRTG Desktop application runs on Windows or macOS – for even quicker access & multi-server views.
Still not convinced?
![]()
More than 500,000 sysadmins love PRTG
Paessler PRTG is used by companies of all sizes. Sysadmins love PRTG because it makes their job a whole lot easier.
Still not convinced?
![]()
Monitor your entire IT infrastructure
Bandwidth, servers, virtual environments, websites, VoIP services – PRTG keeps an eye on your entire network.
![]()
Try Paessler PRTG for free
Everyone has different monitoring needs. That’s why we let you try PRTG for free. Start now with your trial.
|
PRTG |
Network Monitoring Software - Version 24.3.98.1210 (July 31st, 2024) |
|
Hosting |
Download for Windows and cloud-based version PRTG Hosted Monitor available |
Languages |
English, German, Spanish, French, Portuguese, Dutch, Russian, Japanese, and Simplified Chinese |
Pricing |
Up to 100 sensors for free (Price List) |
Unified Monitoring |
Network devices, bandwidth, servers, applications, virtual environments, remote systems, IoT, and more |
Supported Vendors & Applications |
|