![]()
LDAP monitoring with PRTG

PRTG monitors directory
services via LDAP
Quick setup,
intuitive use
Prompt alerts in the event
of errors & disruptions
Developed by Paessler, PRTG is network management software that monitors IT infrastructures composed of devices, applications, and systems.
But that’s not all. You can also use PRTG in distributed networks for the precise monitoring of mail, web, database, and virtual servers – and in particular, LDAP servers.
Definition: What is LDAP?
LDAP (Lightweight Directory Access Protocol) is a simple network protocol for accessing directories. It is the only protocol that allows for communication between an LDAP client and a directory server. By monitoring your LDAP server, you’ll be able to make sure this communication is always running smoothly.
A “directory server” is an LDAP server or a computer that provides a directory service such as Microsoft Active Directory.
Meanwhile, an LDAP protocol refers to a data structure that is created in accordance with the specifications of LDAP.
LDAP in practice
In practice, the communication between the client and server goes like this: An LDAP protocol is used to query (and store) information inside an LDAP directory. This information usually includes data on users, PCs, and the certificates of a computer. Two default ports are used here:
- Port 389 for the unsecured transfer of data
- Port 636 for the transfer of data secured by SSL/TLS
LDAP is an industry-standard authentication and authorization protocol. As a result, every corporate network is likely to have at least one LDAP server whose information should be monitored. Pretty much everything that deals with user data in some form or another supports the LDAP protocol:
- Address data management software such as Outlook and Thunderbird
- User management software such as Microsoft Active Directory Service and Apple Open Directory
- Authentication solutions (e.g., Privileged Access Management)
- User data management solutions for SMTP, POP, and IMAP servers
For network monitoring to be complete, it must also include the monitoring of all LDAP servers. This is where an LDAP monitoring tool like PRTG comes in.
For more detailed information on directory services, feel free to check out our Active Directory.
Why LDAP server monitoring is a must
During LDAP monitoring, the focus isn’t so much on LDAP protocols but on LDAP servers. In particular, the monitoring tool monitors the following parameters of LDAP servers:
- Availability
- Performance
- Logon times
- Response times
These four system parameters are the key performance indicators. LDAP is typically used to authenticate user accounts and users (e.g., the employees of a company). When response times are too high and uptime too low, access to data becomes painstakingly slow – or even nonexistent. This not only causes headaches for users, but also reduces the productivity of your business.
Benefits for your business
With the right monitoring tool, your IT team can monitor the load and speed of your LDAP servers around the clock and immediately take action in the event of anomalies. In particular, LDAP monitoring lets you:
![]() Dramatically increase the availability of servers, applications, and services
Dramatically increase the availability of servers, applications, and services
![]() Quickly detect critical performance issues and resolve them immediately – thereby restoring availability
Quickly detect critical performance issues and resolve them immediately – thereby restoring availability
![]() Prevent network crashes – or reduce them to an absolute minimum
Prevent network crashes – or reduce them to an absolute minimum
Quick start: LDAP monitoring with PRTG
PRTG is an outstanding LDAP monitoring tool. It comes with a predefined LDAP Sensor for monitoring LDAP servers. This sensor is certified as compatible with Microsoft products based on LDAP. It also works with LDAP integrations from other providers, albeit in a non-certified capacity.
Setting up the LDAP Sensor is quick and easy.
When adding the sensor for the first time, a dialog box appears which lets you select or define your LDAP monitoring settings.
Step 1
Create a name for the sensor and (if necessary) tags to improve the classification of the data.
Step 2
Choose whether you wish to establish a secure (SSL) or unsecure connection to the LDAP server.
Step 3
Choose between the default ports 389 and 636 or another port defined by you.
Step 4
Specify the DN (distinguished name).
Step 5
Enter the password for the DN (to authenticate the LDAP server).
Step 6
Specify the settings for the scanning intervals, monitoring schedules, and more.
Trusted by 500,000 users and recognized
by industry analysts as a leader

“Fantastic network and infrastructure monitoring solution that is easy to deploy and easier still to use. Simply the best available.”

“Software is absolutely perfect, Support is superior. Meets all needs and requirements, this is a must have solution if you are needing any form of monitoring.”

“The tool excels at its primary focus of being a unified infrastructure management and network monitoring service.”
So how does an IT team monitor LDAP servers with PRTG?
![]() How PRTG defines sensors
How PRTG defines sensors
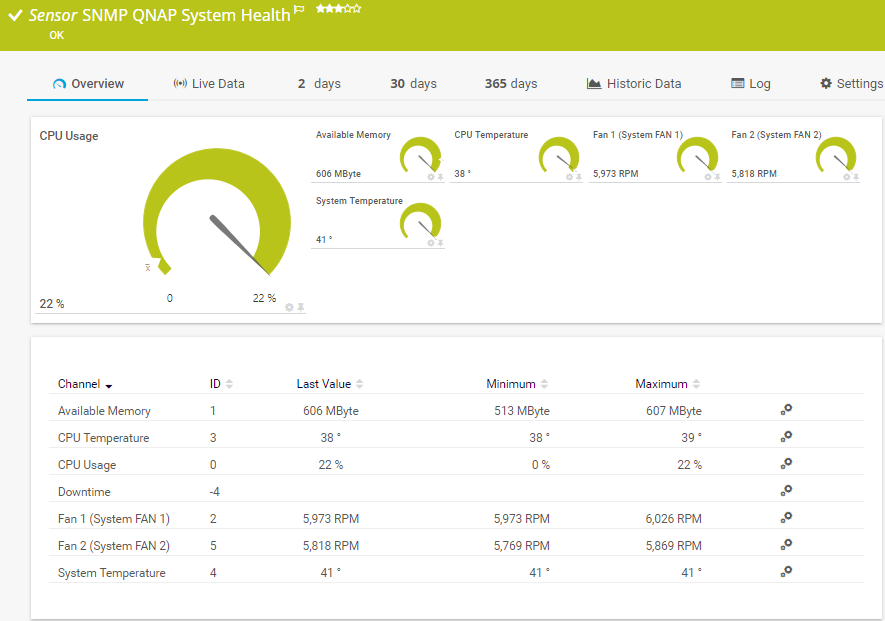
In PRTG, “sensors” are the basic monitoring elements. One sensor usually monitors one measured value in your network, e.g. the traffic of a switch port, the CPU load of a server, the free space of a disk drive. On average you need about 5-10 sensors per device or one sensor per switch port.
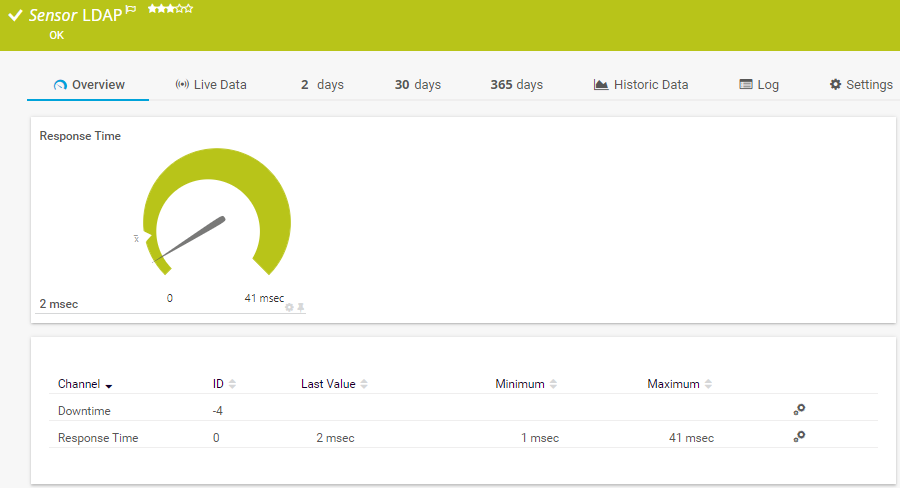
Here’s how it works: PRTG comes equipped with an LDAP Sensor that connects to the LDAP server (or directory) and measures the response time. Technically speaking, this connection is called a “bind” operation, i.e., a login to the LDAP server using the “bind” command.
If the server stops responding (or the response time exceeds a predefined limit), PRTG sends an alert at once. IT administrators receive the alert on their desktop PC or as a push notification on their smartphone. As a result, they can quickly step in and fix the problem.

Create innovative solutions with Paessler’s partners
Partnering with innovative vendors, Paessler unleashes synergies to create
new and additional benefits for joined customers.


UVnetworks
UVexplorer integrates tightly with PRTG to bring fast and accurate network discovery, detailed device inventory, and automatic network mapping to the PRTG platform.
PRTG makes your job easier
Our monitoring software frees you to focus on other tasks by promptly notifying you of potential issues.
![]()
Save effort
PRTG gives you one central monitoring tool for your servers and entire network. Enjoy a quick overview of your whole infrastructure via our dashboard and app.
![]()
Save time
Getting started with PRTG is a breeze. Setting up or switching from another network monitoring tool is easy thanks to the auto-discovery and pre-configured device templates.
![]()
Save money
80% of our customers report substantial cost savings with network monitoring. Your costs of licenses will likely pay for themselves within weeks.

PRTG: The multi-tool for sysadmins
Adapt PRTG individually and dynamically to your needs and rely on a strong API:- HTTP API: Access monitoring data and manipulate monitoring objects via HTTP requests
- Custom sensors: Create your own PRTG sensors for customized monitoring
- Custom notifications: Create your own notifications and send action triggers to external systems
- REST Custom sensor: Monitor almost everything that provides data in XML or JSON format

“The greatest advantage of PRTG? You get to rest easy.“
Steffen Ille, Bauhaus-University of Weimar, Germany
Still not convinced?
![]()
More than 500,000 sysadmins love PRTG
Paessler PRTG is used by companies of all sizes. Sysadmins love PRTG because it makes their job a whole lot easier.
Still not convinced?
![]()
Monitor your entire IT infrastructure
Bandwidth, servers, virtual environments, websites, VoIP services – PRTG keeps an eye on your entire network.
![]()
Try Paessler PRTG for free
Everyone has different monitoring needs. That’s why we let you try PRTG for free. Start now with your trial.
|
PRTG |
Network Monitoring Software - Version 24.3.98.1210 (July 31st, 2024) |
|
Hosting |
Download for Windows and cloud-based version PRTG Hosted Monitor available |
Languages |
English, German, Spanish, French, Portuguese, Dutch, Russian, Japanese, and Simplified Chinese |
Pricing |
Up to 100 sensors for free (Price List) |
Unified Monitoring |
Network devices, bandwidth, servers, applications, virtual environments, remote systems, IoT, and more |
Supported Vendors & Applications |
|
Combining the broad monitoring feature set of PRTG with IP Fabric’s automated network assurance creates a new level of network visibility and reliability.