![]()
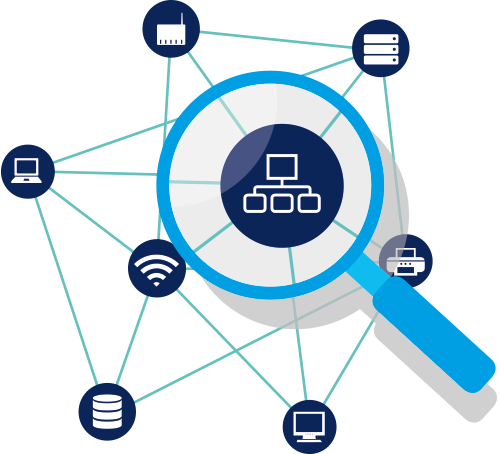
Monitor data usage with PRTG

PRTG monitors the complete data usage of your network
PRTG supports all major protocols like SNMP, Flow, or packet sniffing
PRTG identifies bottlenecks and network errors
Monitor data usage with PRTG Network Monitor
Keep your data usage under control with PRTG
Measuring, analyzing, and monitoring the usage of data is part of standard monitoring tools. However, all of the advantages that are associated with comprehensive data usage monitoring cannot be exploited when using such monitoring tools. This is because certain things can possibly be done incorrectly or, alternatively, with the help of a sophisticated monitoring solution.
The ideal data usage monitoring for you should:
- continuously monitor internet usage
- always keep an eye on bandwidth
- monitor routers and switches
- use SNMP, WMI, packet sniffing, or Flow
- save you a lot of time, nerves, and money
3 considerations to always keep your data usage under control
![]()
Observe bandwidth
Particularly in expanding companies, bandwidth is gradually used to a greater extent. With reliable SNMP sensors, you get an overview of the used bandwidth. With Flow and packet sniffing sensors, you can see which devices and applications are using your bandwidth and to what extent. With a good monitoring solution, you can perform long-term analyses and generate reports with a single click.
![]()
Make sure you have internet access
Often, problems occur because individual routers or switches fail. The reason for this can be missing updates or material damage. With certain sensor types, you can monitor hardware elements such as CPU, memory usage, and hard disks from many manufacturers.
![]()
Eliminate bottlenecks
While looking at typical data usage, you will discover bottlenecks in every network. They mostly occur temporarily or locally. With a good monitoring solution, you can monitor your network 24 hours a day, 7 days a week. This allows you to detect when bottlenecks in internet usage occur, for example, during backups or when using certain applications. This is how you make your network fit.
Wait, what?
Bandwidth is measured as the amount of data that can be transferred from one point to another within a network in a given period of time. Typically, bandwidth is expressed as bit rate and measured in bits per second (bps). It refers to the transmission capacity of a connection and is an important factor in determining the quality and speed of a network. Learn more about bandwidth on this IT Explained page.
Data usage: What makes for good monitoring?
We believe that PRTG is the best solution for reliable data usage monitoring as well as for many other applications.
It has been in the market for over 20 years and it is based on the feedback of 500,000 users.
Fast root cause
identification
Looking for the root cause of slow applications or other problems can be very tedious and costly if you do not have a monitoring tool. PRTG offers you comprehensive monitoring. For monitoring your bandwidth alone, you can choose from around 20 sensors that can be set up automatically. These range from the IPFIX sensor, to the sFlow sensor, and on to the Windows Network Card sensor.
Detect capacity utilization at an early stage
Bandwidth cannot be monitored extensively enough. With PRTG, you are able to detect early when a full utilization of your bandwidth is reached. And you are able to monitor the whole way up to full utilization as well. This way, you can plan new resources in time and your company can grow without having to worry about capacity issues.
Detect bottlenecks
With PRTG, you can monitor bandwidth over a longer period of time and also identify when bandwidth is being used to its fullest. This allows you to plan early on to increase bandwidth at certain times, for example, when your website is under a heavy amount of load, when users are heavily accessing applications, or in other data usage scenarios.
Reduce costs
By detecting and fixing bandwidth hogs, you increase the efficiency of your network. With our bandwidth calculator, you will permanently save costs. These measures alone usually pay for the purchase of PRTG within a short time.
Increase satisfaction
With PRTG, you ensure stable bandwidth, you increase the reliability of your network, and you simply have better control of your IT infrastructure. This is an important part of making your employees work more efficiently and of making your customers more satisfied.
Trusted by 500,000 users and recognized
by industry analysts as a leader
by industry analysts as a leader

“Fantastic network and infrastructure monitoring solution that is easy to deploy and easier still to use. Simply the best available.”

“Software is absolutely perfect, Support is superior. Meets all needs and requirements, this is a must have solution if you are needing any form of monitoring.”

“The tool excels at its primary focus of being a unified infrastructure management and network monitoring service.”
How to set up bandwidth monitoring in PRTG in 4 steps
Let's get concrete and have a look at the data usage monitoring topic to see what questions you need to ask yourself so that you can implement bandwidth monitoring as efficiently as possible:
- What's the difference between WMI, SNMP, Flow, and packet sniffer-based monitoring?
- What are the prerequisites for bandwidth monitoring?
- How to set up bandwidth monitoring in 4 steps?
- How to visualize your bandwidth monitoring data?
- Why should you create a report about your bandwidth monitoring?
The detailed answers to these questions can be found on this how-to page on bandwidth monitoring.

Hey Mathias, what advice would you give an administrator who wants to monitor his bandwidth?
“Instead of additionally trying to measure bandwidth via artificial load, you should look for actions that do it anyway – and then monitor those. For example, when you're doing backups, you often have heavy bandwidth usage and can easily spot bottlenecks.”
Mathias Hengl, PRTG developer at Paessler
Curious to try PRTG for data usage monitoring?
Are you now curious to try our PRTG trial for data usage monitoring and much more?
Congratulations. You are in line with 500,000 other sysadmins whose enthusiasm and feedback
we have used for over more than 20 years to make PRTG a little better every day.
Here comes the deal with our trial:
Below, you can find a link that leads to the PRTG trial page. Our trial runs for 30 days and is guaranteed to be a non-annoying experience. We don't hold anything back and you receive the full PRTG feeling with all the features we have to offer.
If you don't like what you see, you can simply say goodbye and that's it. We might shed a tear or two, but you won't even notice that. After 30 days, PRTG automatically turns into a freeware without you having to do anything (and without losing your previous work and settings). If you love PRTG and would like to keep working with it to monitor data usage and much more, then you can buy one of our licenses, which we think have a fair and transparent pricing.
If you still have a question at this point, you can contact our great support team. Most of our staff still work from home, but we will be happy to answer any of your questions while wearing our favorite pyjamas.
Create innovative solutions with Paessler’s partners
Partnering with innovative vendors, Paessler unleashes synergies to create
new and additional benefits for joined customers.


With ScriptRunner, Paessler integrates a powerful event automation platform into PRTG Network Monitor.
ScriptRunner
PRTG in a nutshell
PRTG monitors your entire IT infrastructure
Use PRTG to monitor, for example, network traffic, applications, bandwidth, cloud services, databases, virtual environments, availability & uptime, ports, IP addresses, hardware status, network security, web services, and much more.
PRTG supports the most important technologies
Monitor your network for example via SNMP, flow protocols (NetFlow, jFlow, sFlow, IPFIX), SSH, WMI, or ping. PRTG also supports technologies used in Industrial IT & OT environments, such as OPC UA, MQTT, or Modbus. Use the powerful PRTG API for custom integrations (for example via Python, PowerShell, or REST).
PRTG can be used for any operating system
Download and install PRTG Network Monitor on a Windows system or use our cloud-based product PRTG Hosted Monitor for all other operating systems. What’s more: our native PRTG Desktop application runs on Windows or macOS – for even quicker access & multi-server views.
Still not convinced?
![]()
More than 500,000 sysadmins love PRTG
Paessler PRTG is used by companies of all sizes. Sysadmins love PRTG because it makes their job a whole lot easier.
Still not convinced?
![]()
Monitor your entire IT infrastructure
Bandwidth, servers, virtual environments, websites, VoIP services – PRTG keeps an eye on your entire network.
![]()
Try Paessler PRTG for free
Everyone has different monitoring needs. That’s why we let you try PRTG for free. Start now with your trial.
|
PRTG |
Network Monitoring Software - Version 24.3.98.1210 (July 31st, 2024) |
|
Hosting |
Download for Windows and cloud-based version PRTG Hosted Monitor available |
Languages |
English, German, Spanish, French, Portuguese, Dutch, Russian, Japanese, and Simplified Chinese |
Pricing |
Up to 100 sensors for free (Price List) |
Unified Monitoring |
Network devices, bandwidth, servers, applications, virtual environments, remote systems, IoT, and more |
Supported Vendors & Applications |
|