![]()
Network jitter?
Get rid of delays for good

Monitor network jitter
Run jitter tests
Keep an eye on VoIP and QoS
Receive prompt jitter alerts
Jitter monitoring in detail
Jitter and VoIP: Congestion on the line
Many companies use VoIP (Voice over Internet Protocol). But if a problem occurs during the transmission
of data packets, then this protocol is in danger of malfunctioning. One single delayed data packet can lead
to transmission errors and delays that are noticeable at once. Jitter can cause the audio signal to go down
or fill the line with static. With PRTG, you'll keep a constant eye on jitter values. If fluctuations occur, you can
quickly intervene to eliminate them. Jitter and VoIP go hand in hand. Along with jitter, you can also monitor
other parameters that affect the quality of your VoIP.
Some sensors to help you get started with jitter monitoring
![]() How PRTG defines sensors
How PRTG defines sensors
In PRTG, “sensors” are the basic monitoring elements. One sensor usually monitors one measured value in your network, e.g. the traffic of a switch port, the CPU load of a server, the free space of a disk drive. On average you need about 5-10 sensors per device or one sensor per switch port.
![]()
QoS (Quality of Service) Round Trip sensor
The PRTG QoS (Quality of Service) Round Trip sensor monitors the quality of your network connection. This sensor measures (or calculates) and displays jitter, latency, packet loss, and MOS (mean opinion score). The jitter value presents the minimum, maximum, and average deviations in milliseconds.
![]()
QoS (Quality of Service) One Way sensor
The QoS (Quality of Service) One Way sensor monitors the quality of the connection between two PRTG probes. The jitter value (minimum, maximum, average) is also displayed by this sensor.
![]()
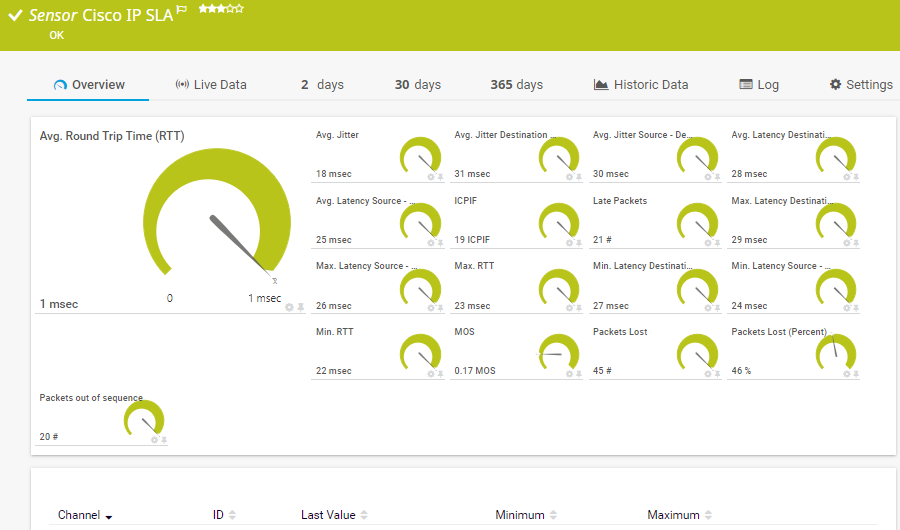
Cisco IP SLA sensor
Cisco devices (e.g. routers and switches) cause jitter to rise. Cisco IP SLA sensor uses SNMP to monitor the Cisco IP Service Level Agreement (SLA). This sensor is perfect for reading and displaying the jitter value.
![]()
Ping Jitter sensor
The Ping Jitter sensor calculates jitter for a series of ping signals. With ping monitoring you can check the availability and the latency of all your network devices.
A sneak peek at VoIP monitoring with PRTG
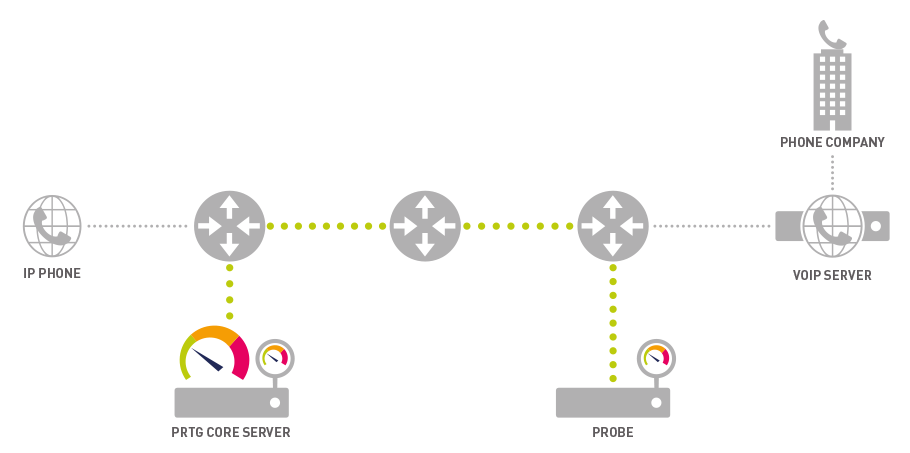
PRTG measures VoIP quality by monitoring the connection between the probe and core server
Cisco IP SLA Sensor
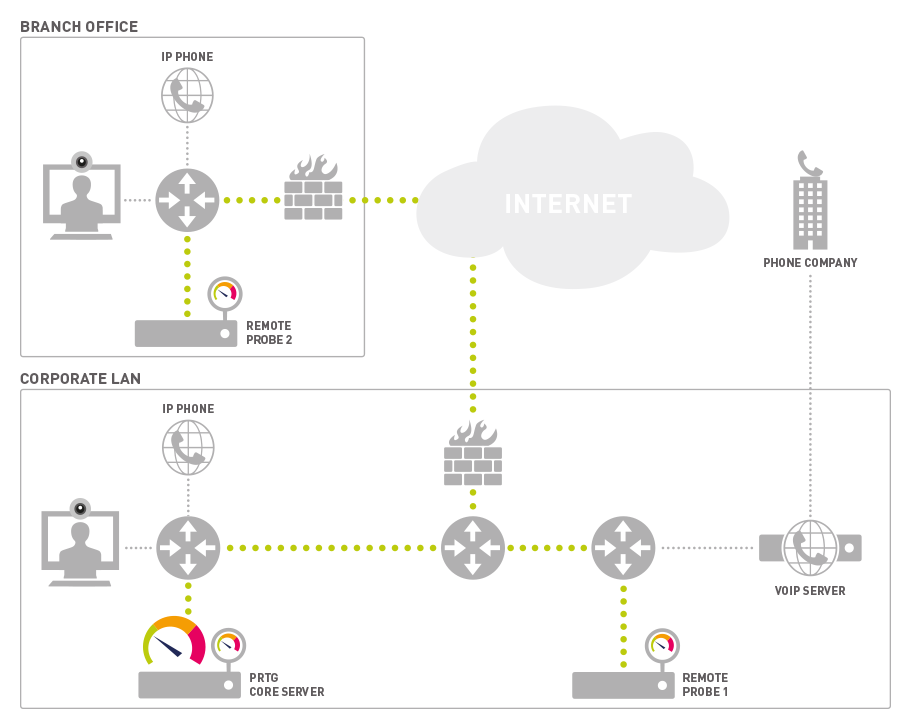
PRTG sends UDP packets back and forth between two remote probes located near VoIP telephones or similar devices, and measures the quality of connections
Jitter tests: The why and the how
Running a jitter test
Create the above-mentioned sensors (e.g. the QoS (Quality of Service) Round Trip sensor). These sensors are preconfigured. There are no trial tests to run and you can read the jitter value directly from your network. PRTG comes with 100 free sensors that never expire. You can therefore test your network for jitter for free.
The results
Individual jitter tests won't tell you much. The reason: They only check jitter for a specific point in time. When testing jitter, you’ll want to determine what is causing your jitter values to fluctuate. This can only be done via continuous and automated jitter monitoring.
Measuring jitter
Jitter is the deviation from the mean latency value, or the amount of time a data packet needs to reach its destination. It is measured in milliseconds (ms) and displayed in the sensor directly. A number of methods are used to measure jitter, including mean packet delay variation and mean absolute packet delay variation. PRTG complies with the standards of the RTCP for measuring jitter (RFC 1889). Learn more about how PRTG calculates jitter here.
The advantages of using PRTG to measure jitter
Stable VoIP
In companies that use VoIP, employees are unable to work unless the network is stable. Provide for optimal network stability by monitoring your VoIP with PRTG. By doing so, you’ll make sure your coworkers are able to work efficiently and without interruption.
Fast-acting alarm
PRTG stands out from other monitoring tools in that all its values are customizable. It immediately notifies you in the event of a problem, so you can react quickly – before noticeable interruptions or crashes arise. Thanks to PRTG, you’ll lift a huge weight off the shoulders of your support team, for fewer and fewer of your coworkers will have incidents to report.
Your network at a glance – even on the go
Set up PRTG in minutes and use it on almost any mobile device.


Practical tip: “Hey Stephan, do you have any tips for VoIP monitoring?”
“To simulate a telephone that uses the same network as your real IP telephone, simply set up our QoS Reflector Script on a Raspberry Pi and connect the latter to the desired point on the network. By doing so, you can guarantee that you are measuring the right network path with our QoS Round Trip Sensor. This is important because VoIP traffic is usually treated with priority.”
Stephan Linke, technical support at Paessler
PRTG makes your job easier
Our monitoring software frees you to focus on other tasks by promptly notifying you of potential issues.
![]()
Save effort
PRTG gives you one central monitoring tool for your servers and entire network. Enjoy a quick overview of your whole infrastructure via our dashboard and app.
![]()
Save time
Getting started with PRTG is a breeze. Setting up or switching from another network monitoring tool is easy thanks to the auto-discovery and pre-configured device templates.
![]()
Save money
80% of our customers report substantial cost savings with network monitoring. Your costs of licenses will likely pay for themselves within weeks.
Trusted by 500,000 users and recognized
by industry analysts as a leader
by industry analysts as a leader

“Fantastic network and infrastructure monitoring solution that is easy to deploy and easier still to use. Simply the best available.”

“Software is absolutely perfect, Support is superior. Meets all needs and requirements, this is a must have solution if you are needing any form of monitoring.”

“The tool excels at its primary focus of being a unified infrastructure management and network monitoring service.”
Jitter and latency: How to optimize your quality of service
![]()
Monitor latency
How much time does a data packet need for its "trip” from the sender to the receiver? This time is referred to as latency. According to ITU-T, the agency responsible for telecommunications standards, latencies of up to 125 milliseconds are acceptable. PRTG’s recommendation: Set a threshold for 100 milliseconds. You’ll immediately receive an alert if this value is exceeded, allowing you to act quickly before noticeable interruptions or crashes arise.
![]()
Monitor jitter
Jitter measures the variation in a mean latency value. We recommend that this deviation be less than 20 to 25 milliseconds, even if this amount is somewhat lower than what is usually considered acceptable. The important thing is that you become aware of jitter as quickly as possible so you can take action at once. It also depends on your expectations: for some, jitter and delays of any kind are unacceptable.
![]()
Monitor packets
Individual packets are often responsible for problems with VoIP. Packets can get lost or arrive as duplicates or in the wrong order. PRTG lets you identify each of these scenarios. We recommend setting your loss rate threshold at 0%, for just one lost packet can generate an error message or lead to a malfunction.
![]()
The short and sweet of it: All you need to know about jitter
What is jitter?
Data packets are transmitted at a certain speed. A sender sends packets to a receiver in millisecond intervals. Jitter occurs when this interval gets off track, leading to deviations or irregularities in runtime. The term "jitter” means fluctuation, oscillation, or a variation in frequency.
What happens if jitter is too high?
If data packets reach a receiver at irregular intervals, then loopholes emerge. As a result, data can no longer be circulated on a continual basis. While this may not be a big deal for web or email applications, it can cause interruptions in phone and video calls for companies who use VoIP. You’re also likely to encounter glitches at home when running real-time applications such as videos or computer games.
What causes jitter?
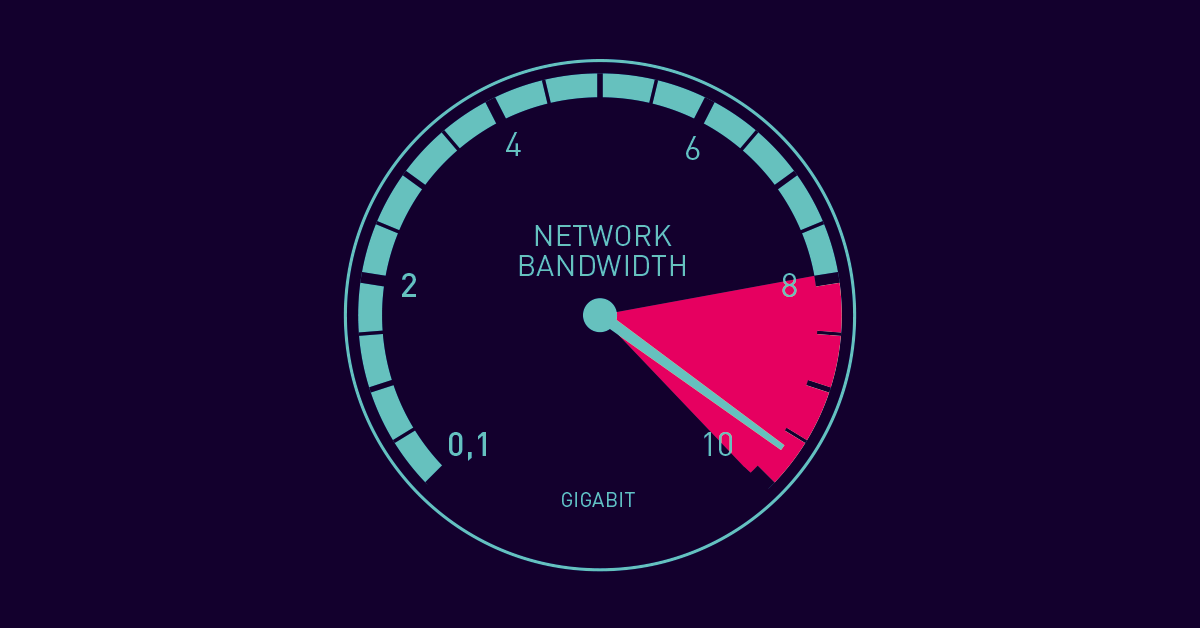
One example of how jitter can spike is when a data line is heavily strained, causing bottlenecks to appear in intermediate devices. In such a case, your available bandwidth is usually not sufficient (make a bandwidth test). High jitter can also be caused by data congestion in switches and routers. PRTG promptly alerts you if your hardware is overstrained, so you can intervene quickly – before your system malfunctions.
![]() Bandwidth is measured as the amount of data that can be transferred from one point to another within a network in a specific amount of time. Typically, bandwidth is expressed as a bitrate and measured in bits per second (bps). It refers to the transmission capacity of a connection and is an important factor when determining the quality and speed of a network.
Bandwidth is measured as the amount of data that can be transferred from one point to another within a network in a specific amount of time. Typically, bandwidth is expressed as a bitrate and measured in bits per second (bps). It refers to the transmission capacity of a connection and is an important factor when determining the quality and speed of a network.
Read more
How do I eliminate jitter?
If jitter is high, then you may want to increase your bandwidth. Usually, however, this comes at an additional charge. As an alternative, you can give higher priority to VoIP than to other data packets, such as emails.
How is jitter calculated?
Jitter is calculated mathematically and in a standardized fashion. The IETF has outlined its jitter calculation method in RFC 3550. PRTG uses this protocol to calculate jitter.

“The greatest advantage of PRTG? You get to rest easy.“
Steffen Ille, Bauhaus-University of Weimar, Germany

PRTG: The multi-tool for sysadmins
Adapt PRTG individually and dynamically to your needs and rely on a strong API:- HTTP API: Access monitoring data and manipulate monitoring objects via HTTP requests
- Custom sensors: Create your own PRTG sensors for customized monitoring
- Custom notifications: Create your own notifications and send action triggers to external systems
- REST Custom sensor: Monitor almost everything that provides data in XML or JSON format
Create innovative solutions with Paessler’s partners
Partnering with innovative vendors, Paessler unleashes synergies to create
new and additional benefits for joined customers.


UVnetworks
UVexplorer integrates tightly with PRTG to bring fast and accurate network discovery, detailed device inventory, and automatic network mapping to the PRTG platform.
Still not convinced?
![]()
More than 500,000 sysadmins love PRTG
Paessler PRTG is used by companies of all sizes. Sysadmins love PRTG because it makes their job a whole lot easier.
Still not convinced?
![]()
Monitor your entire IT infrastructure
Bandwidth, servers, virtual environments, websites, VoIP services – PRTG keeps an eye on your entire network.
![]()
Try Paessler PRTG for free
Everyone has different monitoring needs. That’s why we let you try PRTG for free. Start now with your trial.
|
PRTG |
Network Monitoring Software - Version 24.3.98.1210 (July 31st, 2024) |
|
Hosting |
Download for Windows and cloud-based version PRTG Hosted Monitor available |
Languages |
English, German, Spanish, French, Portuguese, Dutch, Russian, Japanese, and Simplified Chinese |
Pricing |
Up to 100 sensors for free (Price List) |
Unified Monitoring |
Network devices, bandwidth, servers, applications, virtual environments, remote systems, IoT, and more |
Supported Vendors & Applications |
|