![]()
Facilitate IP packet analysis with the IP sniffer PRTG
- Analyzes packet headers & filters traffic by IP addresses
- Displays IP traffic data in customizable graphs
- Sounds the alarm in the event of IP anomalies
Our users give top ratings for monitoring with Paessler PRTG


PRTG IP sniffer: What you’ll find on this page

PRTG makes sniffing IP addresses easy
Custom alerts and data visualization make it easy to monitor, identify, and prevent IP traffic issues.
Single IP sniffers vs. all-in-one network monitoring tools
IP sniffers
Many IP sniffers on the market let you analyze individual IP packets, but without the full network overview provided by Paessler PRTG. These tools give you detailed information on the data that is carried in each respective packet (packet capture) and discover any suspicious data traffic in the network, but they lack insight into other areas of your infrastructure.
Network monitoring tools
Network monitoring tools like PRTG let you monitor your entire wireless and local network,, including its hardware, applications, virtual machines, network traffic, and more. You can keep an eye on bandwidth and filter your traffic by type, protocol, source, and destination. PRTG’s built-in alarm system immediately notifies you of potential issues so that you can act in time.
“All-around winning “The real beauty of PRTG is the endless possibilities it offers” “PRTG Network MonitorIT experts agree: Paessler PRTG is a great solution for IT infrastructure monitoring

network monitor”

is very hard to beat”
Start advanced IP sniffing with PRTG and see how it can make your network more reliable and your job easier.
Why PRTG is your comprehensive IP sniffing tool
PRTG comes with more than 250 preconfigured sensors for monitoring your entire IT infrastructure, including packet sniffing, flow monitoring, and traffic monitoring via SNMP.
Packet sniffing
The Packet Sniffer sensor monitors your traffic, then filters it by IP address, protocol, and connection. It also analyzes the headers of incoming and outgoing data packets. All this IP packet analysis data is presented on customizable graphs and so-called toplists.
Flow monitoring
PRTG monitors all the major flow protocols (IPFIX, NetFlow, jFlow, sFlow). As with the Packet Sniffer sensor, you can break down your traffic by IP address, protocol, and port to take a closer look. The NetFlow protocol is used mostly by Cisco devices, which you can monitor with our NetFlow v5and NetFlow v9 sensors (preconfigured or custom).
SNMP Traffic monitoring
The SNMP Traffic sensor monitors traffic on a device using the Simple Network Management Protocol. It shows the number of incoming and outgoing errors, discarded packets, unicast and non-unicast packets; the incoming, outgoing, and total traffic; and the number of incoming unknown protocols.
What sniffing IPs looks like in PRTG
Diagnose network issues by continuously monitoring and analyzing IP data traffic. Show packet header analysis in real time and visualize data in graphic maps & dashboards to identify problems more easily. Gain the visibility you need to troubleshoot problems in your IT infrastructure.

Sunburst view of the entire monitoring setup
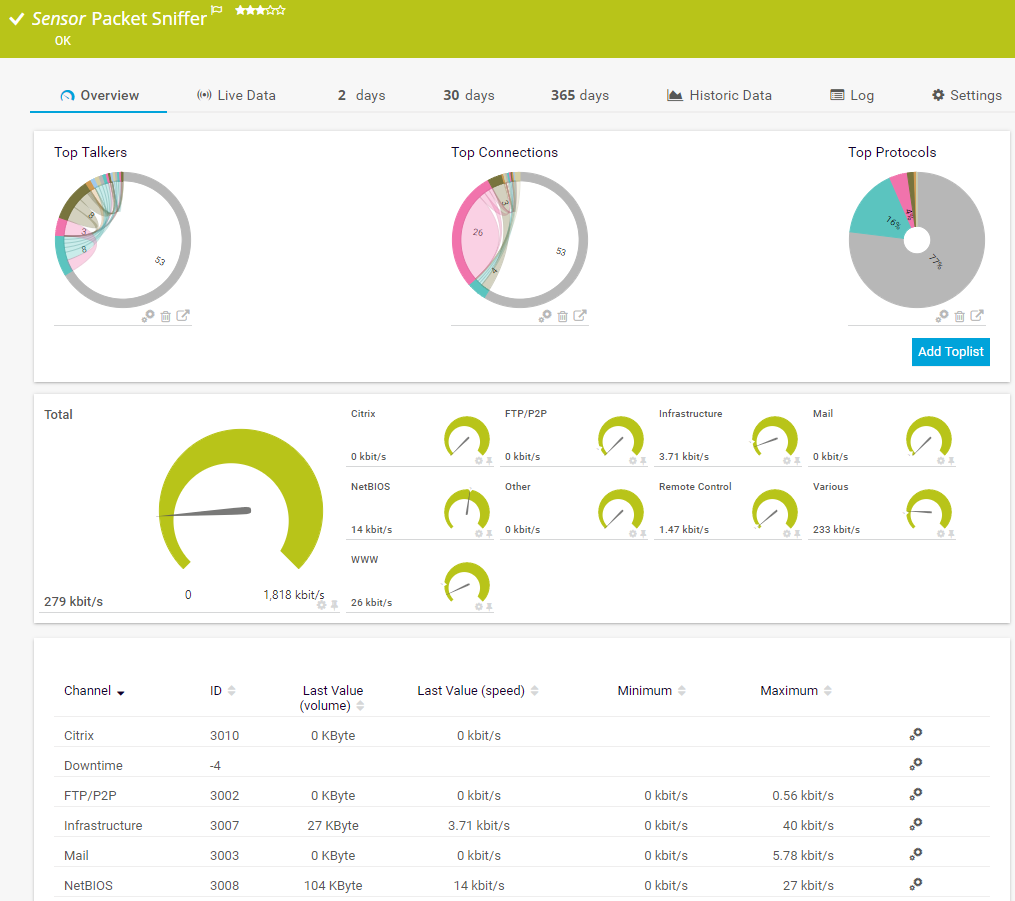
Packet Sniffer sensor in PRTG
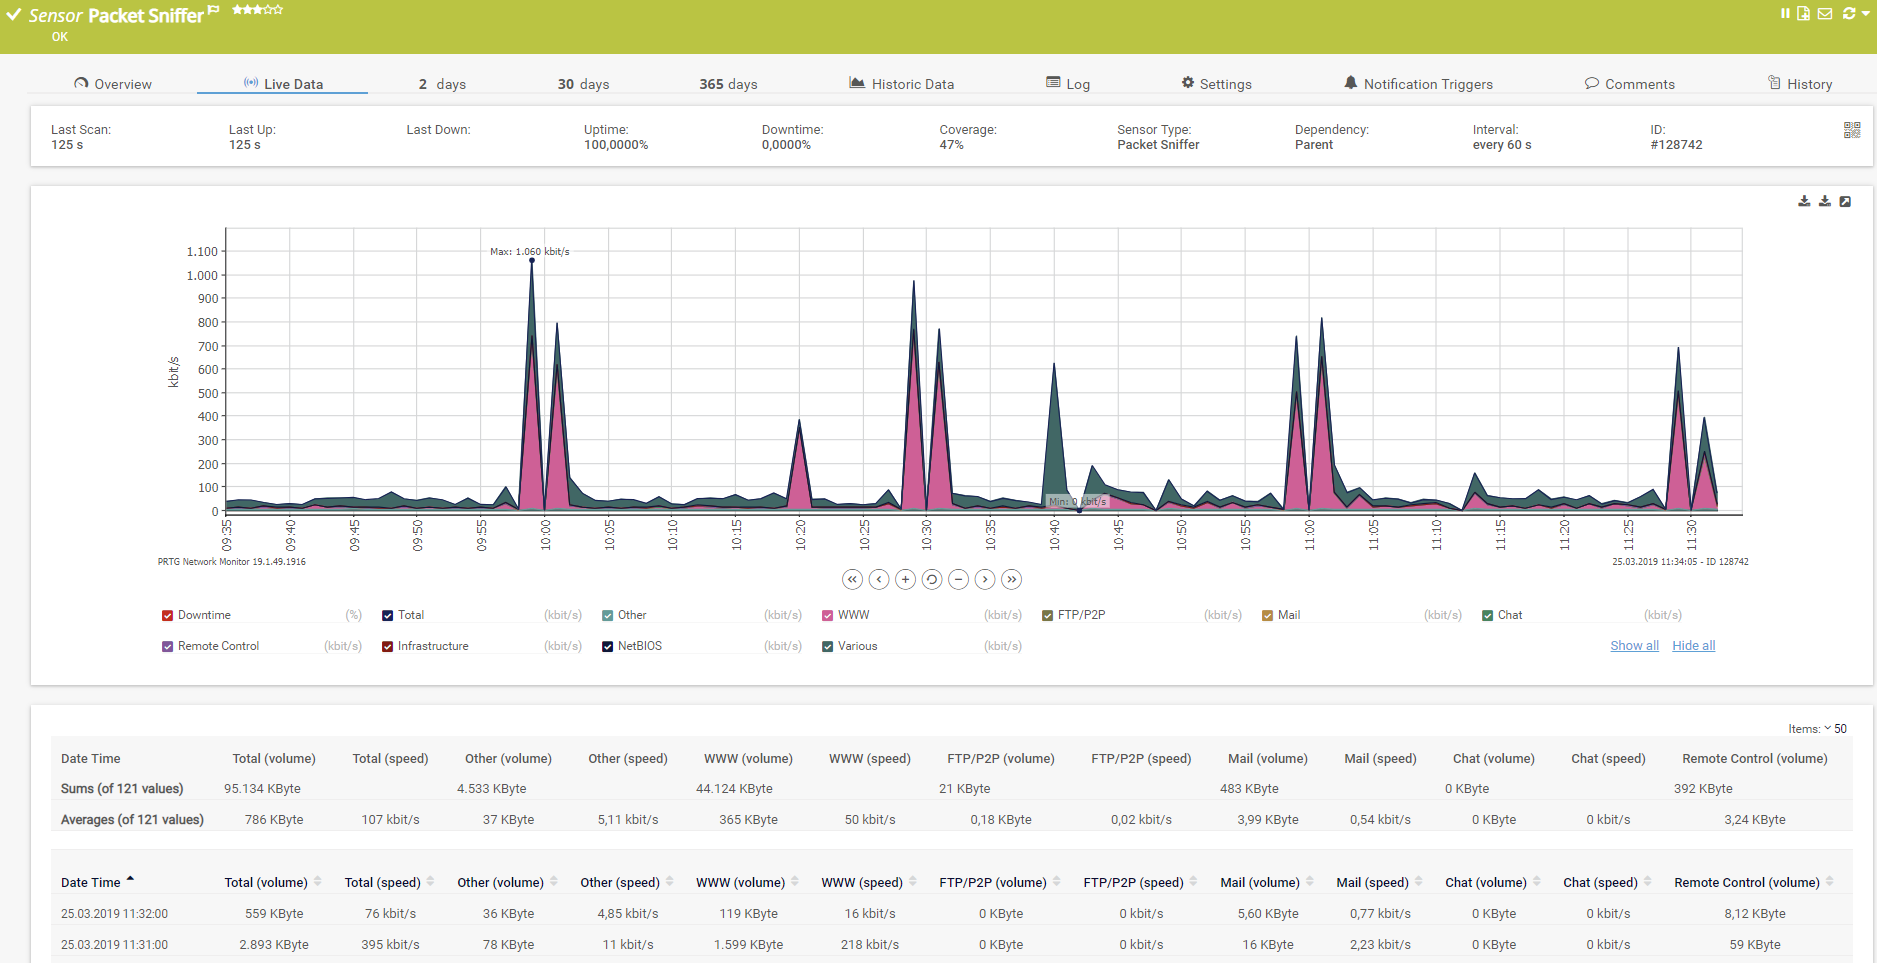
Live traffic data graph
Easily find the source of the problem with our PRTG IP sniffer solution
Real-time alerts and custom notifications make it easy to solve issues with IP traffic data and analysis.
PRTG is compatible with all major vendors, products, and systems
![]()
IP sniffing with PRTG: Immediate results or long-term planning
One-time IP sniff
You can use IP sniffing with PRTG as an analyzer to resolve a specific problem. Example: Getting to the root of a short-term spike in traffic.
Continuous IP monitoring
You can also use IP sniffing with PRTG to plan and develop your network infrastructure. It keeps a constant eye on your entire network, using historical data to recognize long-term trends.
Traffic analysis with PRTG compared
|
| WMI | SNMP | Packet sniffing | Flow (IPFIX, NetFlow, sFlow, jFlow) |
|---|---|---|---|---|
| Setup | Medium | Easy | Easy to complex (depending on filter rules used) | Can be complex (the switch must be configured, for example) |
| Filters traffic |
|
|
| |
| Shows toplist graphs (Top Talkers, Top Connections, Top Protocols) |
|
|
|
|
| Filters bandwidth usage by IP address |
|
|
| |
| Filters bandwidth usage by MAC address |
|
|
|
|
| Filters bandwidth usage by physical network port |
|
|
|
|
| Monitors network parameters other than bandwidth usage |
|
|
|
|
| CPU load on the machine running PRTG | Medium | Low | Higher, depends on the amount of traffic | Higher, depends on the amount of traffic |
| Excess bandwidth usage of monitoring | Small | Small | None (except when monitoring switch ports are used) | Depends on the traffic |
PRTG makes sniffing IP addresses easy
Custom alerts and data visualization make it easy to monitor, identify, and prevent IP traffic issues.
Your network sniffer at a glance – even on the go
Set up PRTG in minutes and use it on almost any mobile device.


Create innovative solutions with Paessler’s partners
Partnering with innovative vendors, Paessler unleashes synergies to create
new and additional benefits for joined customers.
With ScriptRunner, Paessler integrates a powerful event automation platform into PRTG Network Monitor.
ScriptRunner

UVexplorer integrates tightly with PRTG to bring fast and accurate network discovery, detailed device inventory, and automatic network mapping to the PRTG platform.
UVnetworks
“Excellent tool for detailed monitoring. Alarms and notifications work greatly. Equipment addition is straight forward and server initial setup is very easy. ...feel safe to purchase it if you intend to monitor a large networking landscape.”
Infrastructure and Operations Engineer in the Communications Industry, firm size 10B - 30B USD
Easily find the source of the problem with our PRTG IP sniffer solution
Real-time alerts and custom notifications make it easy to solve issues with IP traffic data and analysis.
IP sniffer: FAQ
1. What is IP sniffing?
IP sniffing, also known as packet sniffing or network sniffing, is the practice of intercepting and examining data packets flowing across a computer network. This technique is often used for troubleshooting network issues, but it can also be exploited for malicious purposes, such as capturing sensitive information like usernames and passwords. Unauthorized IP sniffing b ymalware or other attacks is generally considered a security risk and can violate privacy.
2. What is an IP sniffer tool?
A sniffer is a tool or program that inspects data traffic on network devices. Incoming and outgoing data traffic is “sniffed” as it passes through network interfaces. Sniffers log data packets and use IP addresses to identify senders and recipients.
3. How do I use an IP sniffer?
If you have a critical problem – such as unusually high network traffic or trouble transmitting data – an IP sniffer will help you uncover the cause. IP sniffers can even be used to sniff the traffic itself (i.e. individual data packets). The PRTG Packet Sniffer sensor monitors traffic around the clock, including the distribution of traffic across devices, applications, and IP addresses.
4. How do I set up IP sniffing with PRTG?
When you run PRTG for the first time, the Auto-Discovery feature will be launched automatically. Simply enter a range of IP addresses. PRTG will add all the devices (servers, routers, switches, firewalls, etc.) within this range to your monitoring environment. You can then create the Packet Sniffer sensor separately on the server whose traffic you wish to monitor, or via the monitoring port of your switch if you wish to include all traffic in your monitoring.
5. What is an IP scanner?
The terms “IP scanner” or “network scanner” are often used synonymously with “IP sniffer.” However, IP scanners are mostly used to scan operating systems such as Windows, Mac, or Linux, while IP sniffing tools are used more globally.
6. What is a sensor in PRTG?
In PRTG, “sensors” are the basic monitoring elements. One sensor usually monitors one measured value in your network, for example the traffic of a switch port, the CPU load of a server, or the free space on a disk drive.
On average, you need about 5-10 sensors per device or one sensor per switch port.
We asked: would you recommend PRTG?
Over 95% of our customers say yes!
Paessler conducted trials in over 600 IT departments worldwide to tune its network monitoring software closer to the needs of sysadmins.
The result of the survey: over 95% of the participants would recommend PRTG – or already have.


PRTG: The multi-tool for sysadmins
Adapt PRTG individually and dynamically to your needs and rely on a strong API:- HTTP API: Access monitoring data and manipulate monitoring objects via HTTP requests
- Custom sensors: Create your own PRTG sensors for customized monitoring
- Custom notifications: Create your own notifications and send action triggers to external systems
- REST Custom sensor: Monitor almost everything that provides data in XML or JSON format
Paessler PRTG is used by companies of all sizes. Sysadmins love PRTG because it makes their job a whole lot easier. Bandwidth, servers, virtual environments, websites, VoIP services – PRTG keeps an eye on your entire network. Everyone has different monitoring needs. That’s why we let you try PRTG for free.Still not convinced?
![]()
More than 500,000
sysadmins love PRTG![]()
Monitor your entire IT infrastructure
![]()
Try Paessler PRTG
for free
![]()
Start IP sniffing with PRTG and see how it can make your network more reliable and your job easier.
|
PRTG |
Network Monitoring Software - Version 24.3.98.1210 (July 31st, 2024) |
|
Hosting |
Download for Windows and cloud-based version PRTG Hosted Monitor available |
Languages |
English, German, Spanish, French, Portuguese, Dutch, Russian, Japanese, and Simplified Chinese |
Pricing |
Up to 100 sensors for free (Price List) |
Unified Monitoring |
Network devices, bandwidth, servers, applications, virtual environments, remote systems, IoT, and more |
Supported Vendors & Applications |
|