![]()
CPU temperature monitoring with PRTG
Keep it cool in your hardware and its surroundings
- Monitor CPUs, servers, routers, switches, and other hardware across your network
- Get automatically alerted when there's risk of overheating
- Compatible with Cisco, Dell, HPE, and other major hardware manufacturers
Our users give top ratings for monitoring with Paessler PRTG


PRTG CPU temperature monitoring: What you’ll find on this page

PRTG makes CPU temperature monitoring easy
Custom alerts and data visualizations make it easy to monitor, identify, and prevent high CPU loads, cooling system failures, and other causes of overheating.
Are your CPUs too hot to handle?
CPU temperatures fluctuate. That's normal.
It's when they start spiking regularly that they can cause serious issues. Making your network less stable, inflating your organization's utility bills (cue grumpy accountants calling you to complain), and, worst of all, potentially becoming a fire risk.
With Paessler PRTG, it won't have to come to that.
Our more than 250 preconfigured sensor types watch CPU temperatures, other environmental values, and key network health and performance stats, enabling you to run a more efficient IT infrastructure, extend your hardware's lifespan, and keep your components cool.
4 reasons why PRTG is the CPU temperature monitoring tool of your choice
If you can't stand the heat… turn it down. But to do this, you first need to know that it’s getting hot. PRTG keeps an eye on the temperature of your CPUs as well as your entire server room 24/7, giving you the peace of mind to know that everything’s just fine.
Intuitive interface
PRTG's interface feels instantly familiar. That's by design. We've worked hard so you can get up and running and find your way around our dashboard in no time. But you also have the option to tailor your monitoring environment exactly the way you want it.
Automatic alerts
Pick your parameters and let PRTG do the work. Once you've set your preferred CPU temperature limits and other monitoring thresholds, you'll get alerted when a device is at risk of breaching them, so you can fix the issues pronto (and avoid setting off the fire alarm).
All-in-one monitoring
It's not just for tracking CPU temperatures. PRTG also keeps an eye on humidity levels, the availability and status of your power supplies, and much more. Keep your infrastructure stable and secure (and your colleagues and higher-ups happy) with a fraction of the effort.
Start monitoring CPU temperatures with PRTG and see how it can make your network more reliable and your job easier.
“All-around winning “The real beauty of PRTG is the endless possibilities it offers” “PRTG Network MonitorIT experts agree: Paessler PRTG is a great solution for IT infrastructure monitoring

network monitor”

is very hard to beat”
What CPU temperature monitoring looks like in PRTG
Diagnose network issues by continuously monitoring the temperature of CPUs, routers, switches, and other hardware components. Show CPU load, cooling system status, memory usage, and other key metrics in real time and visualize data in graphic maps & dashboards to identify problems more easily. Gain the visibility you need to troubleshoot the causes of overheating.

Device tree view of the complete monitoring setup
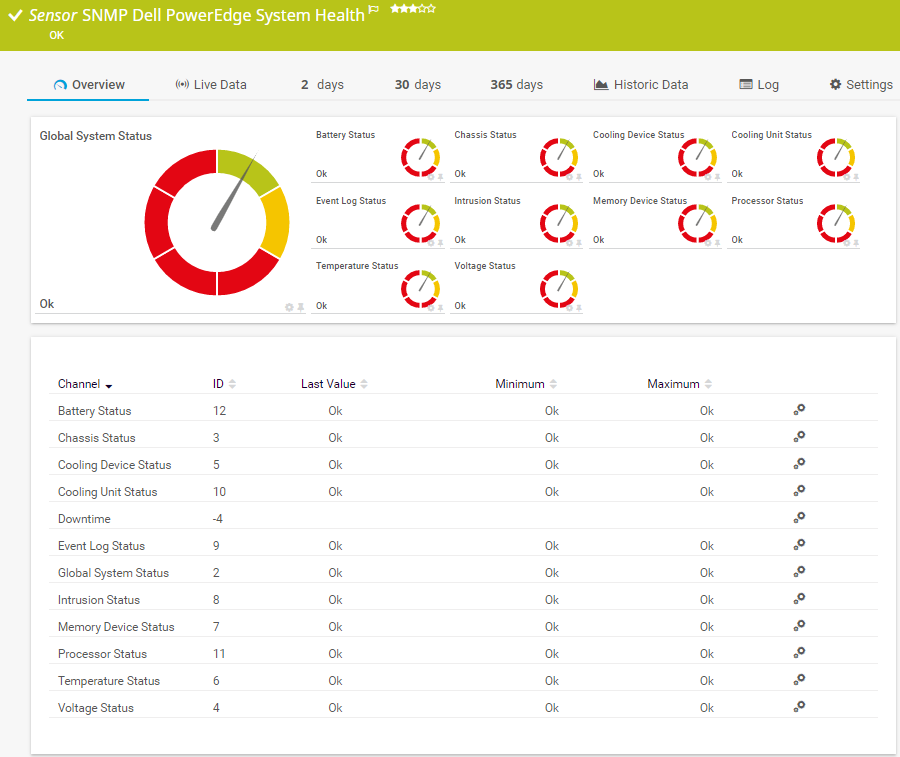
Preconfigured SNMP Dell PowerEdge System Health sensor in PRTG

Custom PRTG dashboard for keeping an eye on the entire IT infrastructure
Easily find the source of the problem with our PRTG CPU temperature monitoring solution
Real-time alerts and custom notifications make it easy to solve issues such as cooling system failures, poorly optimized hardware or software, and other causes of overheating.
PRTG is compatible with all major vendors, products, and systems
![]()
Take your entire network's temperature, with one comprehensive tool
PRTG constantly monitors CPU temperature and other important hardware parameters, alerting you when they're at risk of falling below (or exceeding) predetermined thresholds so you can swoop in and fix the problem.
Our preconfigured, device-specific sensors include:
- SNMP Cisco System Health sensor
- SNMP Dell PowerEdge System Health sensor
- SNMP HPE ProLiant System Health sensor
- SNMP NetApp System Health sensor
- WMI HDD Health sensor
PRTG also integrates with hardware devices such as Jacarta, Netatmo, and Poseidon, enabling you to track ambient temperature, leaks, open doors or windows, and other environmental values from one place.
Your CPU temperature monitor at a glance – even on the go
Set up PRTG in minutes and use it on almost any mobile device.


Create innovative solutions with Paessler’s partners
Partnering with innovative vendors, Paessler unleashes synergies to create
new and additional benefits for joined customers.

With the combination of PRTG and Insys, the monitoring specialist Paessler and the industrial gateway manufacturer INSYS icom offer a practical possibility to merge IT and OT.
INSYS icom

“Excellent tool for detailed monitoring. Alarms and notifications work greatly. Equipment addition is straight forward and server initial setup is very easy. ...feel safe to purchase it if you intend to monitor a large networking landscape.”
Infrastructure and Operations Engineer in the Communications Industry, firm size 10B - 30B USD
PRTG makes CPU temperature monitoring easy
Custom alerts and data visualizations make it easy to monitor, identify, and prevent high CPU loads, cooling system failures, and other causes of overheating.
Monitor CPU temperature: FAQ
Why do CPUs overheat?
CPUs overheat for all sorts of reasons. The most obvious causes are poor air flow, high ambient temperatures, and cooling system malfunctions. But technical issues such as resource-heavy processes, outdated firmware, and poorly optimized hardware or software can also cause overheating by making the CPU operate inefficiently or work too hard.
How hot is too hot for a processor?
A CPU is too hot if its temperature is higher than the maximum specified by the manufacturer. The limit varies depending on the make and model, but it's typically somewhere between 60°C to 90°C (if you're in the US, that's 140°F to 194°F). If a CPU goes over this limit for any sustained period of time, it can cause network disruptions and become a fire hazard. The device will also be less reliable and have a shorter lifespan.
Why use PRTG as CPU temperature monitoring software?
Because it makes it easier to spot and address the causes of overheating – including those that might not be immediately obvious – before your device becomes unstable or, worse, dangerous. Alongside CPU temperature, PRTG also monitors other key variables that might damage your hardware and make your network less safe and reliable, such as humidity levels and the status of power distribution units and uninterruptible power supplies.
I want to monitor a device's temperature, but it doesn't make the information available. Now what?
No temperature data? No problem. You can get around it by monitoring other key stats that might impact performance and cause your device to overheat. PRTG has sensors for every variable imaginable, including application performance, CPU load, memory, email, website, and even CCTV monitoring.
What is a sensor in PRTG?
In PRTG, “sensors” are the basic monitoring elements. One sensor usually monitors one measured value in your network, for example the traffic of a switch port, the CPU load of a server, or the free space on a disk drive.
On average, you need about 5-10 sensors per device or one sensor per switch port.

PRTG: The multi-tool for sysadmins
Adapt PRTG individually and dynamically to your needs and rely on a strong API:- HTTP API: Access monitoring data and manipulate monitoring objects via HTTP requests
- Custom sensors: Create your own PRTG sensors for customized monitoring
- Custom notifications: Create your own notifications and send action triggers to external systems
- REST Custom sensor: Monitor almost everything that provides data in XML or JSON format
Paessler conducted trials in over 600 IT departments worldwide to tune its network monitoring software closer to the needs of sysadmins. We asked: would you recommend PRTG?
Over 95% of our customers say yes!
The result of the survey: over 95% of the participants would recommend PRTG – or already have.
Paessler PRTG is used by companies of all sizes. Sysadmins love PRTG because it makes their job a whole lot easier. Bandwidth, servers, virtual environments, websites, VoIP services – PRTG keeps an eye on your entire network. Everyone has different monitoring needs. That’s why we let you try PRTG for free.Still not convinced?
![]()
More than 500,000
sysadmins love PRTG![]()
Monitor your entire IT infrastructure
![]()
Try Paessler PRTG
for free
![]()
Start monitoring CPU temperatures with PRTG and see how it can make your network more reliable and your job easier.
|
PRTG |
Network Monitoring Software - Version 24.3.98.1210 (July 31st, 2024) |
|
Hosting |
Download for Windows and cloud-based version PRTG Hosted Monitor available |
Languages |
English, German, Spanish, French, Portuguese, Dutch, Russian, Japanese, and Simplified Chinese |
Pricing |
Up to 100 sensors for free (Price List) |
Unified Monitoring |
Network devices, bandwidth, servers, applications, virtual environments, remote systems, IoT, and more |
Supported Vendors & Applications |
|