![]()
PRTG for server rooms: Monitoring
temperatures in the data center

Measure and monitor the temperature of your server room
Prevent damage to servers and interruptions to your business
Monitor IoT devices and Beckhoff industrial PCs
Monitoring temperatures in the data center
By using a DCIM (data center infrastructure management) tool at your company, you'll benefit from more comprehensive monitoring. After all, it’s about more than just monitoring your IT infrastructure.
Server room, temperature, and environmental monitoring must also be included in your overall monitoring plan. The reason? Excessive server room temperatures and humidity can cause serious damage to hardware and interrupt the flow of your business.
Why data center temperature monitoring is a must
Server racks can heat up and increase the temperature of the server room. Overloaded systems and hardware also result in higher operating temperatures, adding to the heat of the environment and making the servers even hotter.
Excessive temperatures affect the performance of your servers. In fact, servers stop working properly as soon as the server room reaches a temperature of 35°C (95°F). The temperature of your server room should be between 22°C (72°F) and 25°C (77°F). You also need to pay attention to its level of humidity: 30% to 60% is ideal.
Your server room should be well air-conditioned and monitored by a temperature monitoring tool. The following problems can arise when server rooms are too hot and humid:
- Servers are less reliable
- Servers crash
- Heat-related anomalies occur on hot days
- Hardware and systems become damaged
- Services are interrupted
- Data is lost
Server room monitoring: What is data center temperature monitoring?

“Data center temperature monitoring” involves keeping an eye on the physical conditions of a data center. In particular, it is used to continually monitor and manage the temperature and humidity of the server room. During server room monitoring, software (or a tool) measures the values of all the devices responsible for keeping the room dry and cool.
A sneak peek at data center monitoring with PRTG
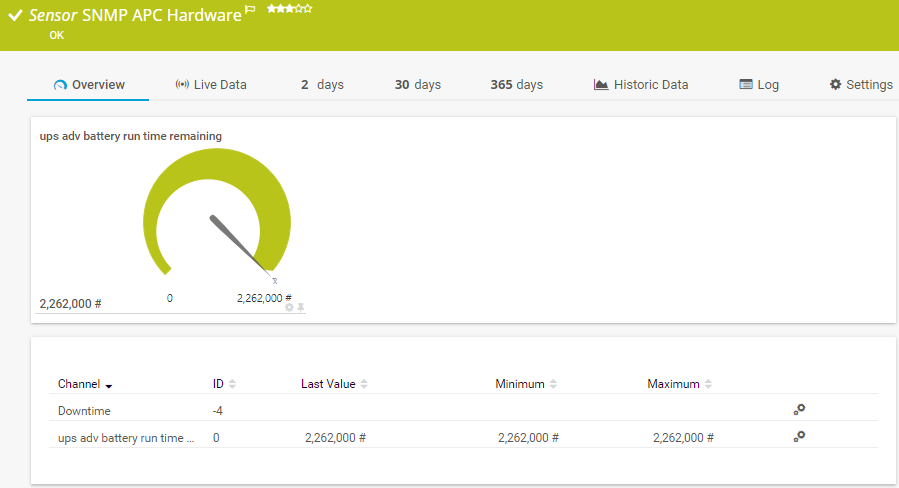
SNMP APC Hardware Sensor
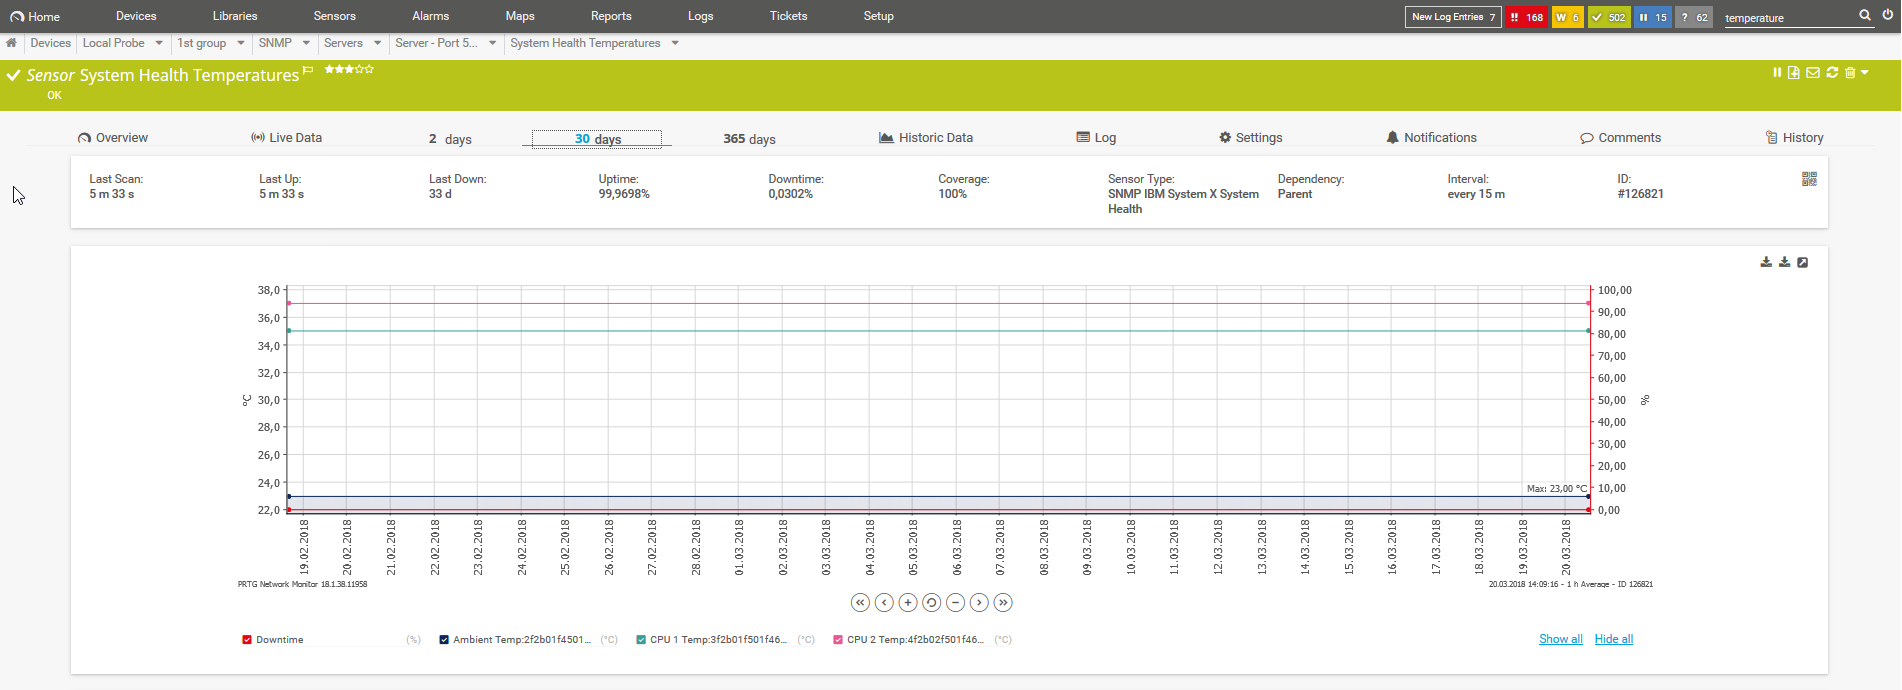
Sensor System Health Temperature
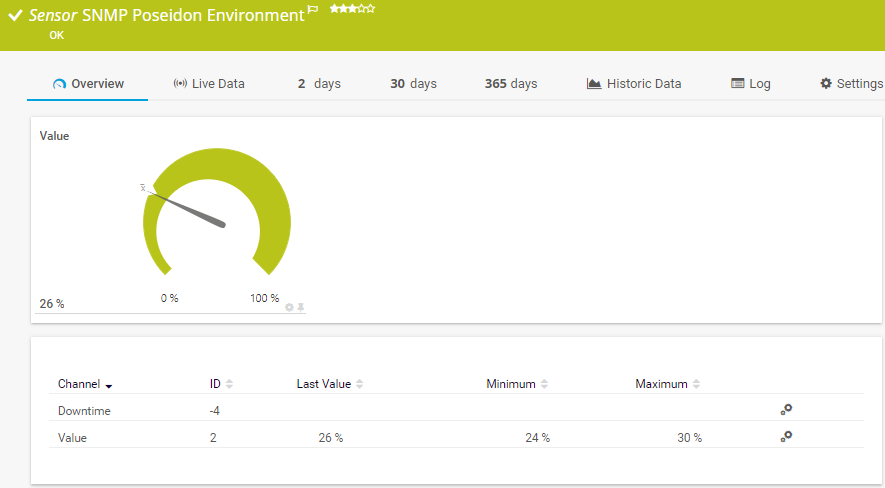
SNMP Poseidon Environment Sensor
Your network monitoring at a glance
Set up PRTG in minutes and use it on almost any mobile device.


How does PRTG monitor data centers?
During server room monitoring, PRTG monitors the temperature of your:
- Air conditioners
- Cooling fans
- Server cooling systems
- Ventilation systems
How it works:
Upon setting up PRTG to monitor A/C systems, you’ll enter threshold values for the maximum temperatures. If the temperature in the server room (or the temperature of the systems that cool the server room) rises above the respective threshold value, you’ll be notified at once. With PRTG, you can choose to be alerted any number of ways, including by:
- SMS
- Push notification
- A flashing taskbar icon
Once you receive an alert, you can quickly take action and adjust the cooling system settings to bring the temperature of the server room or hardware back down to an acceptable level.
Trusted by 500,000 users and recognized
by industry analysts as a leader

“Fantastic network and infrastructure monitoring solution that is easy to deploy and easier still to use. Simply the best available.”

“Software is absolutely perfect, Support is superior. Meets all needs and requirements, this is a must have solution if you are needing any form of monitoring.”

“The tool excels at its primary focus of being a unified infrastructure management and network monitoring service.”
Sensors and temperature sensors for IoT and IIoT
![]()
Beckhoff IPC Sensor for industrial PCs
The PRTG Beckhoff IPC System Health Sensor makes monitoring easy by keeping a constant eye on the system status of a Beckhoff industrial PC (IPC). Among other things, this sensor monitors the CPU temperature, motherboard temperature, and fan speed. IT teams can use the data collected by PRTG to determine the status of the processor, the quality of the ventilation, and any potential impurities in the fan.
The following parameters of the Beckhoff IPC System Health Sensor come partially preconfigured and can be adjusted as needed:
- Scan interval
- Number of scan intervals for which a sensor request must fail before the sensor goes into error mode
- Monitoring schedule (period during which scans should be performed)
- Maintenance window with start & end date/time (period in which the monitoring should be paused)
- Elements to be monitored (e.g., motherboard temperature, CPU temperature, RAID controller status, available memory, etc.)
![]()
HTTP IoT Push Data Advanced Sensor for industrial environments
The HTTP IoT Push Data Advanced Sensor is designed to monitor IoT systems. It displays data from messages that are received from IoT devices and sent to PRTG via an HTTPS request. This sensor comes in handy when you want to redirect data to an instance of PRTG Hosted Monitor. You can use it to incorporate data from the temperature sensors of a variety of different manufacturers.
![]()
Modbus TCP Custom Sensor for TCP servers
This sensor connects to a Modbus Transmission Control Protocol (TCP) server and monitors up to 5 returned numeric values. It lets you monitor peripheral devices such as cooling units and power supplies.
With PRTG, you get an all-in-one monitoring tool that provides for the comprehensive monitoring of your entire data center. After all, PRTG monitors server rooms in the same way as data centers: it keeps an eye on both your IT infrastructure and networks, as well as the technology and systems you use to cool your server room. PRTG also lets you monitor the data and values of physical hardware such as security cameras, power supplies, and access control systems.

PRTG: The multi-tool for sysadmins
Adapt PRTG individually and dynamically to your needs and rely on a strong API:- HTTP API: Access monitoring data and manipulate monitoring objects via HTTP requests
- Custom sensors: Create your own PRTG sensors for customized monitoring
- Custom notifications: Create your own notifications and send action triggers to external systems
- REST Custom sensor: Monitor almost everything that provides data in XML or JSON format

“The greatest advantage of PRTG? You get to rest easy.“
Steffen Ille, Bauhaus-University of Weimar, Germany
Create innovative solutions with Paessler’s partners
Partnering with innovative vendors, Paessler unleashes synergies to create
new and additional benefits for joined customers.
Combining their tools to a powerful solution for advanced analysis and automation, KnowledgeRiver and Paessler enable IT teams to ensure best performance for their infrastructure and networks.
KnowledgeRiver


Still not convinced?
![]()
More than 500,000 sysadmins love PRTG
Paessler PRTG is used by companies of all sizes. Sysadmins love PRTG because it makes their job a whole lot easier.
Still not convinced?
![]()
Monitor your entire IT infrastructure
Bandwidth, servers, virtual environments, websites, VoIP services – PRTG keeps an eye on your entire network.
![]()
Try Paessler PRTG for free
Everyone has different monitoring needs. That’s why we let you try PRTG for free. Start now with your trial.
|
PRTG |
Network Monitoring Software - Version 24.3.98.1210 (July 31st, 2024) |
|
Hosting |
Download for Windows and cloud-based version PRTG Hosted Monitor available |
Languages |
English, German, Spanish, French, Portuguese, Dutch, Russian, Japanese, and Simplified Chinese |
Pricing |
Up to 100 sensors for free (Price List) |
Unified Monitoring |
Network devices, bandwidth, servers, applications, virtual environments, remote systems, IoT, and more |
Supported Vendors & Applications |
|